
Richard Russell, an exceptionally well-regarded Dow Theorist, explained that a stock market can do absolutely anything over short periods of time. Yet, over longer periods, the greatest certainty is “regression to the mean.”
“Regression to the mean” refers to the inevitability of prices revisiting a long-term trend. For example, near the beginning of the Roaring ’20s, stock prices sat nearly 60% below their long-term historical trend. As the Roaring ’20s rolled along, demand for equities outstripped supply to such an extent, the stock market had climbed 80% above its mean.

When stock assets crashed in October of 1929, it had not been a foregone conclusion. Yet price regression had been a sure thing. Prices always re-couple.
It is unquestionably true that nobody is capable of predicting when or how stock prices will revisit their mean. On the flip side, “2-sigma events” are rare in and of themselves; that is stocks only hit or approached 2 standard deviation tops in 1901, 1929 and 2007. Monstrous bearish collapses followed.
A 3-sigma event is even more improbable. The peak in 2000 eclipsed three standard deviations. Shortly thereafter, stock prices reverted toward their historical trend, dragging equities lower over a lengthy two-year nine month bear.
At the beginning of the 2018 trading year, the stock market was a whopping 117% above trend. And that was before the powerful surge higher out of the January gate.
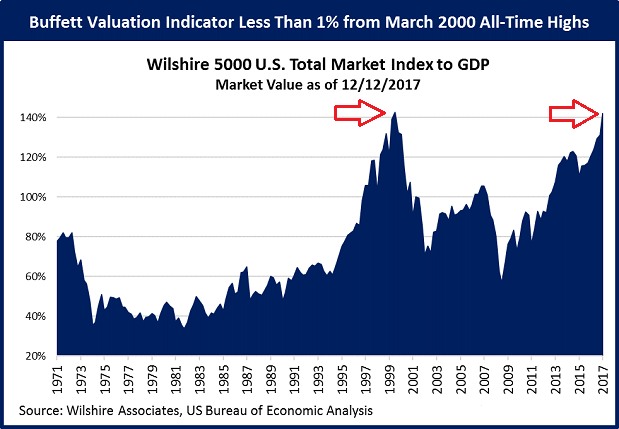
Exuberant folks will be quick to point out that regression analysis demonstrates that financial markets are not as irrational as they were in 2000. I suppose that depends upon one’s perspective. There are plenty of indications, such as the “Buffett Indicator,” that we are very close indeed.
Taking note of the circumstances is not synonymous with the prediction of a market free fall. It is, however, a recognition that prices re-couple.


Leave A Comment