HIGHLIGHTS
BITCOIN (XBT/USD)
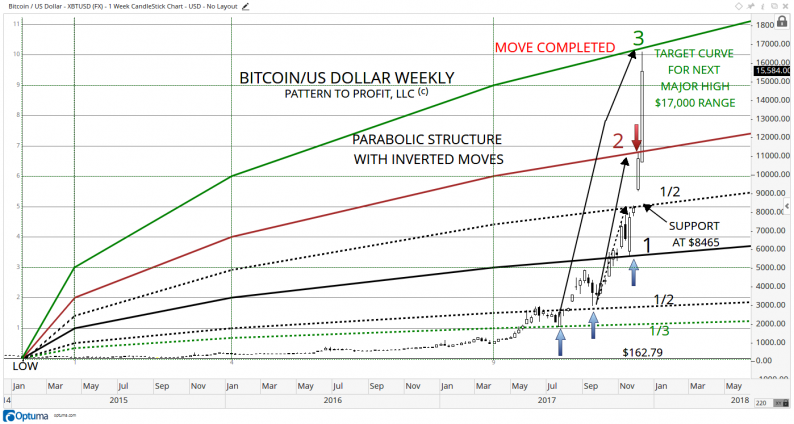
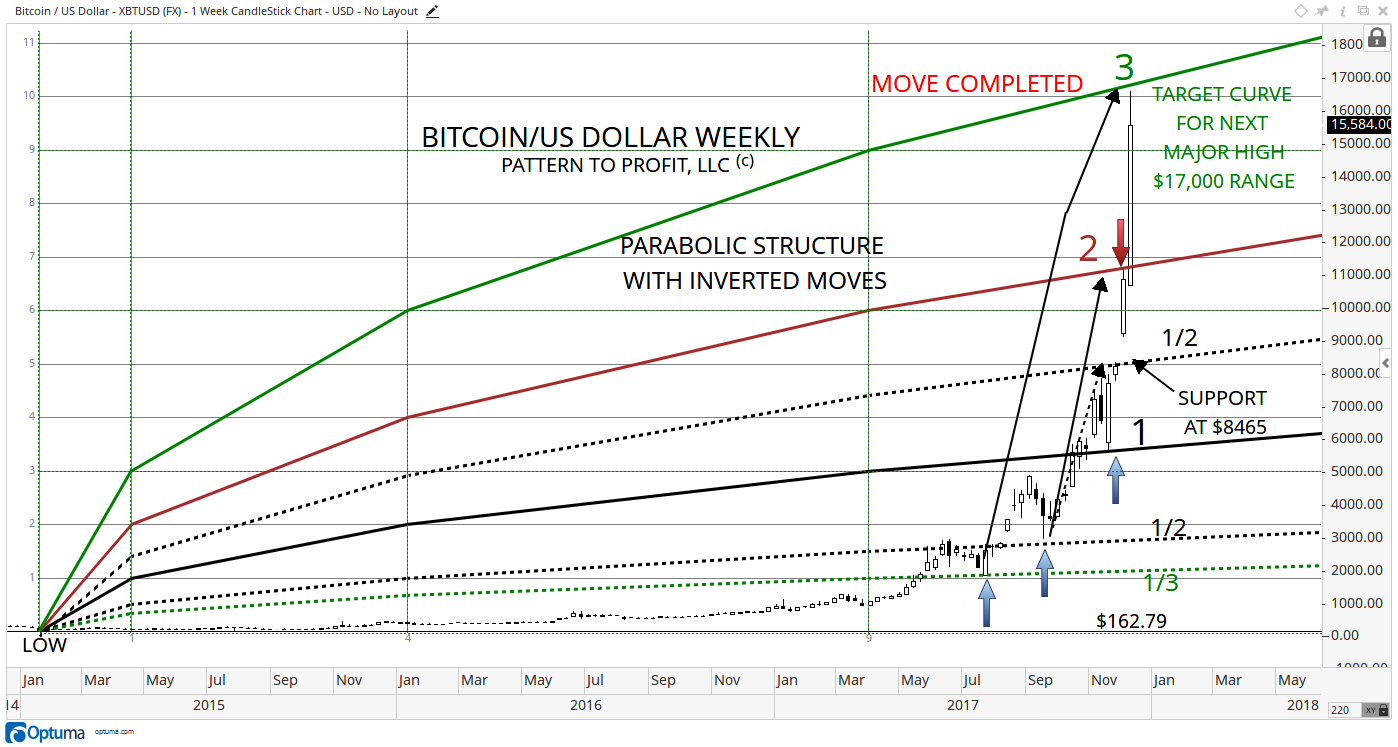
Bitcoin saw another dramatic week higher last week, topping out at $16,613.50 (Optuma price. Due to volatility data providers have recorded a number of different high prices for the week.) and completing the inverted move predicted in the weekly parabolic structure analysis we published on December 1, 2017. Here is the updated weekly chart:
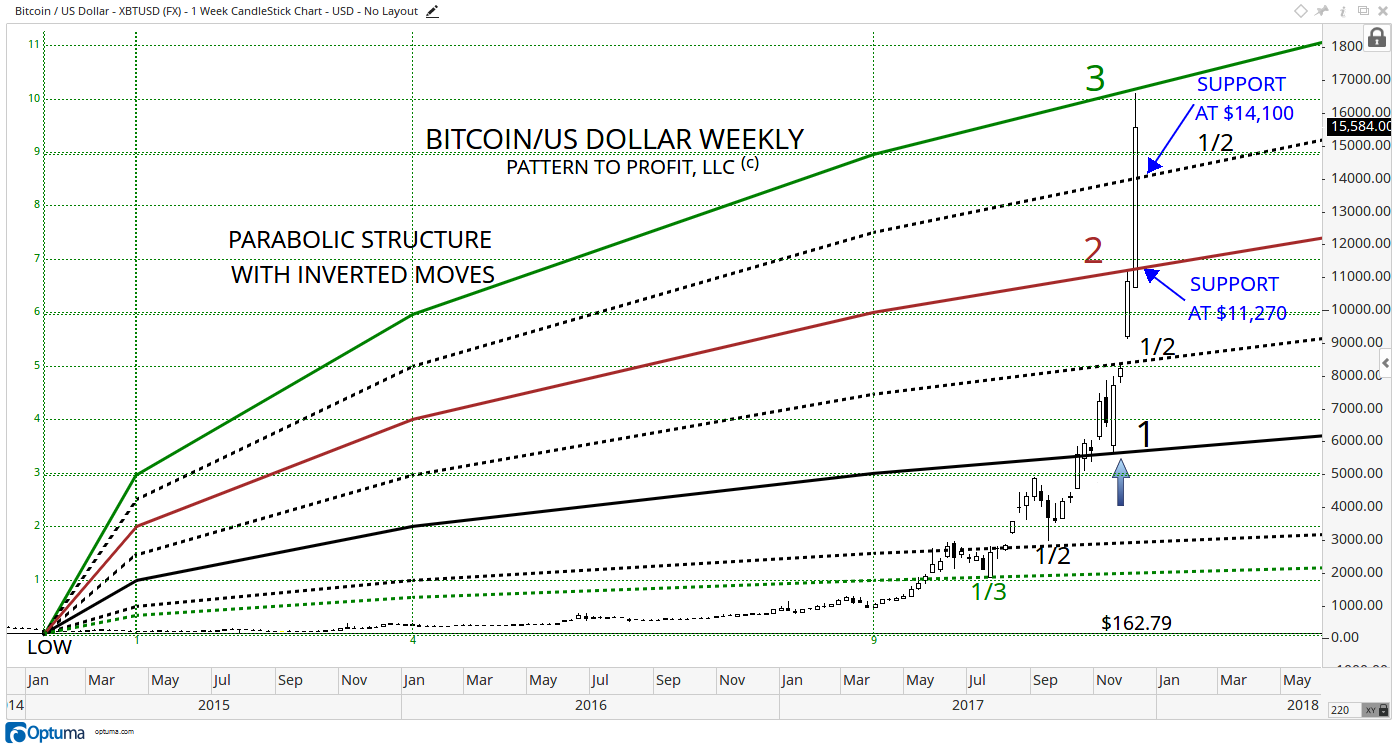
The market is expected to drop to a related support curve below, within the parabolic structure. Curves 2.5 and 2 should provide the more significant potential support zones on a drop, to around $14,100 and $11,270, respectively:
Turning now to a daily chart for greater detail, the vector concentric circles analysis provides an accurate support curve identifying the preceding two lows over the past two weeks, on November 24 and 30. This coming Monday’s support level is at $12,850, and leads up to Thursday’s support at the circle intersection of $14,300. That roughly aligns with weekly support of $14,100 that was seen on the preceding daily chart. When two or methods identify a similar price level, the price area should be given extra consideration.
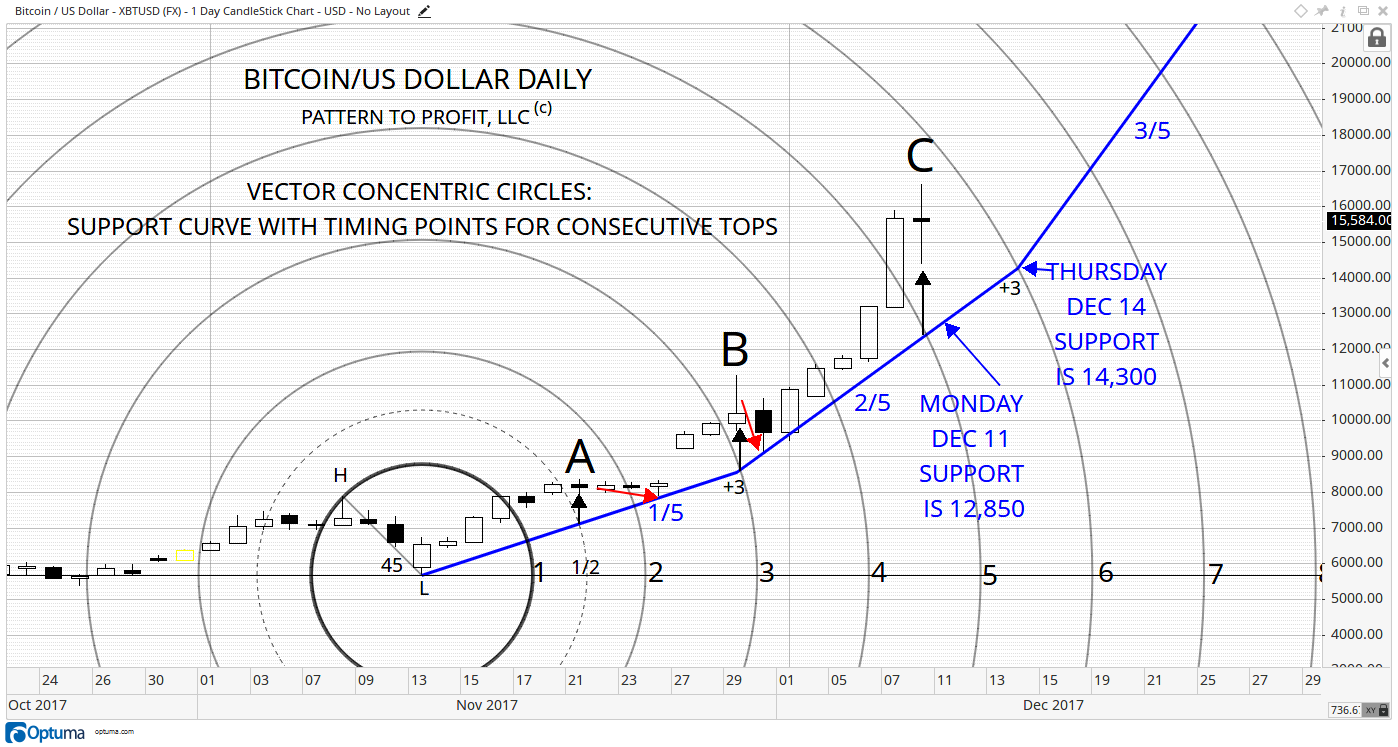
The vector concentric circles are formed from setting the downtrend vector at 45o (marked H-L). The support curve is formed by a succession of fractionally related angles moving forward (and backwards if needed) by a specific pattern of circles. In this example, a 1/5 angle (1/5 of 90o, or 18o) is drawn from the center outward by three full circles (+3 at a time), increasing by 1/5 each time as well.
Note the highs at A & B, directly above the support curve intersecting concentric circles 1.5 & 3. The current potential top at C is also above the intersection below, and this observation strengthens the likelihood of at least a minor top forming with a subsequent drop back down to some level of support.


Leave A Comment