
There are a few events in investing that have a high likelihood of being good predictors of the equity market’s future direction, like, stock prices follow earnings, market breadth leads price, or an inverted yield curve leads economic weakness. One factor I believe the bears have missed in the recent market advance seems to be their discounting of the increasing strength of corporate earnings growth. The improved earnings growth picture has not only improved the market’s valuation, but as the below chart shows, the faster earnings growth seems to be pulling stocks higher as well.

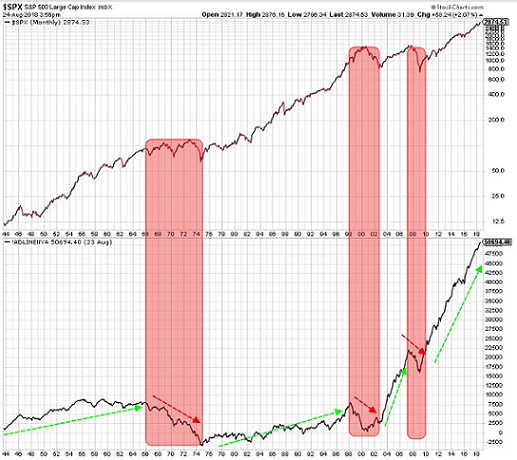
As it relates to breadth and stock prices, Ryan Detrick of LPL Research recently published the below chart. The top portion of the chart is a graph of the S&P 500 Index. The bottom half of the chart is the advance decline line for the New York Stock Exchange Index. The red shaded areas represent times declining issues have exceeded advancing issues. During those times the S&P 500 Index exhibited weakness. On the other hand, outside of the red shading represent times advancing stocks exceeded declining stocks. During the times the advance decline line was rising, stock prices rose as well. One could then conclude recent positive breadth was a precursor to this week’s record high reached in the S&P 500 Index, i.e., breadth leads price.
This leads me to the yield curve and its high propensity to be a good predictor of future stock price direction. According to a paper from the Federal Reserve Bank of San Francisco,
“Every U.S. recession in the past 60 years was preceded by a negative term spread, that is, an inverted yield curve. Furthermore, a negative term spread was always followed by an economic slowdown and, except for one time, by a recession. While the current environment is somewhat special—with low interest rates and risk premiums—the power of the term spread to predict economic slowdowns appears intact.”


Leave A Comment