
Retail sales were down according to US Census headline data. Our analysis agrees..

Backward data revisions were mixed.
Econintersect Analysis:

U.S. Census Headlines:
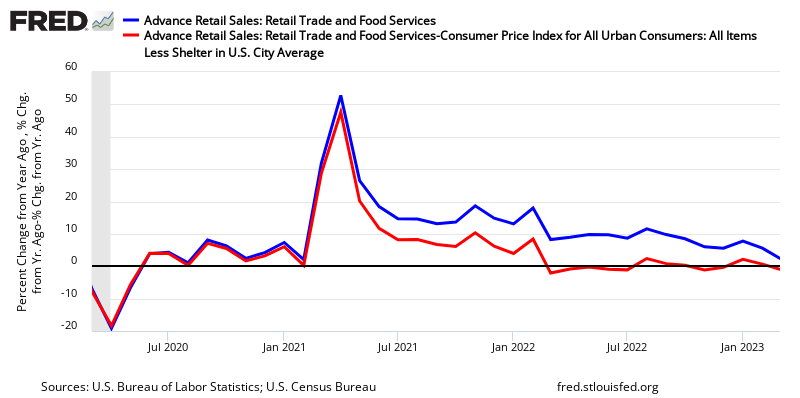
Year-over-Year Change – Unadjusted Retail Sales (blue line) and Inflation Adjusted Retail Sales (red line)
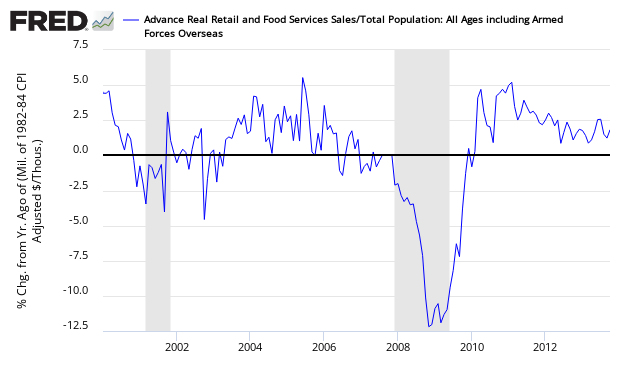
Retail sales per capita seem to be in a long term downtrend (but short term trends appear to be growing – see graph below).
Year-over-Year Change – Per Capita Seasonally Adjusted Retail Sales
From the U.S. Census Bureau press release:
Advance estimates of U.S. retail and food services sales for June 2017, adjusted for seasonal variation and holiday and trading-day differences, but not for price changes, were $473.5 billion, a decrease of 0.2 percent (± 0.5 percent)* from the previous month, and 2.8 percent (± 0.9 percent) above June 2016. Total sales for the April 2017 through June 2017 period were up 3.8 percent (± 0.7 percent) from the same period a year ago. The April 2017 to May 2017 percent change was revised from down 0.3 percent (± 0.5 percent)* to down 0.1 percent (± 0.2 percent)*. Retail trade sales were down 0.1 percent (± 0.5 percent)* from May 2017, and up 3.0 percent (± 0.7 percent) from last year. Nonstore Retailers were up 9.2 percent (± 1.8 percent) from June 2016, while Sporting Goods, Hobby, Book, & Music Stores were down 8.9 percent (± 2.1 percent) from last year.


Leave A Comment