The U.S. stock market indexes were mixed between -0.5% and +0.3% on Friday, as investors took some short-term profits off the table following the recent advance. The S&P 500 index has reached the new record high of 2,940.91. The Dow Jones Industrial Average gained 0.3% and the technology Nasdaq Composite lost 0.5% on Friday.
The nearest important level of support of the S&P 500 index remains at 2,915-2,920, marked by Thursday’s daily gap up of 2,912.36-2,919.73. The next support level is at 2,900. The support level is also at 2,885-2,890, marked by the recent local lows. On the other hand, the level of resistance is at around 2,940-2,950.
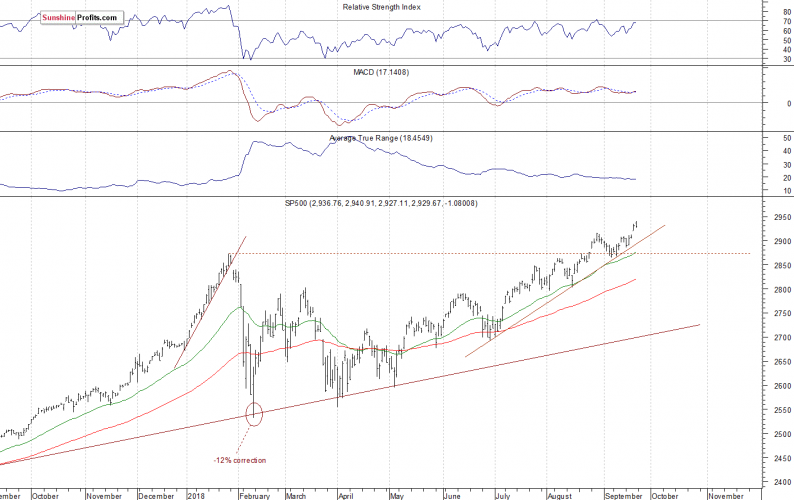
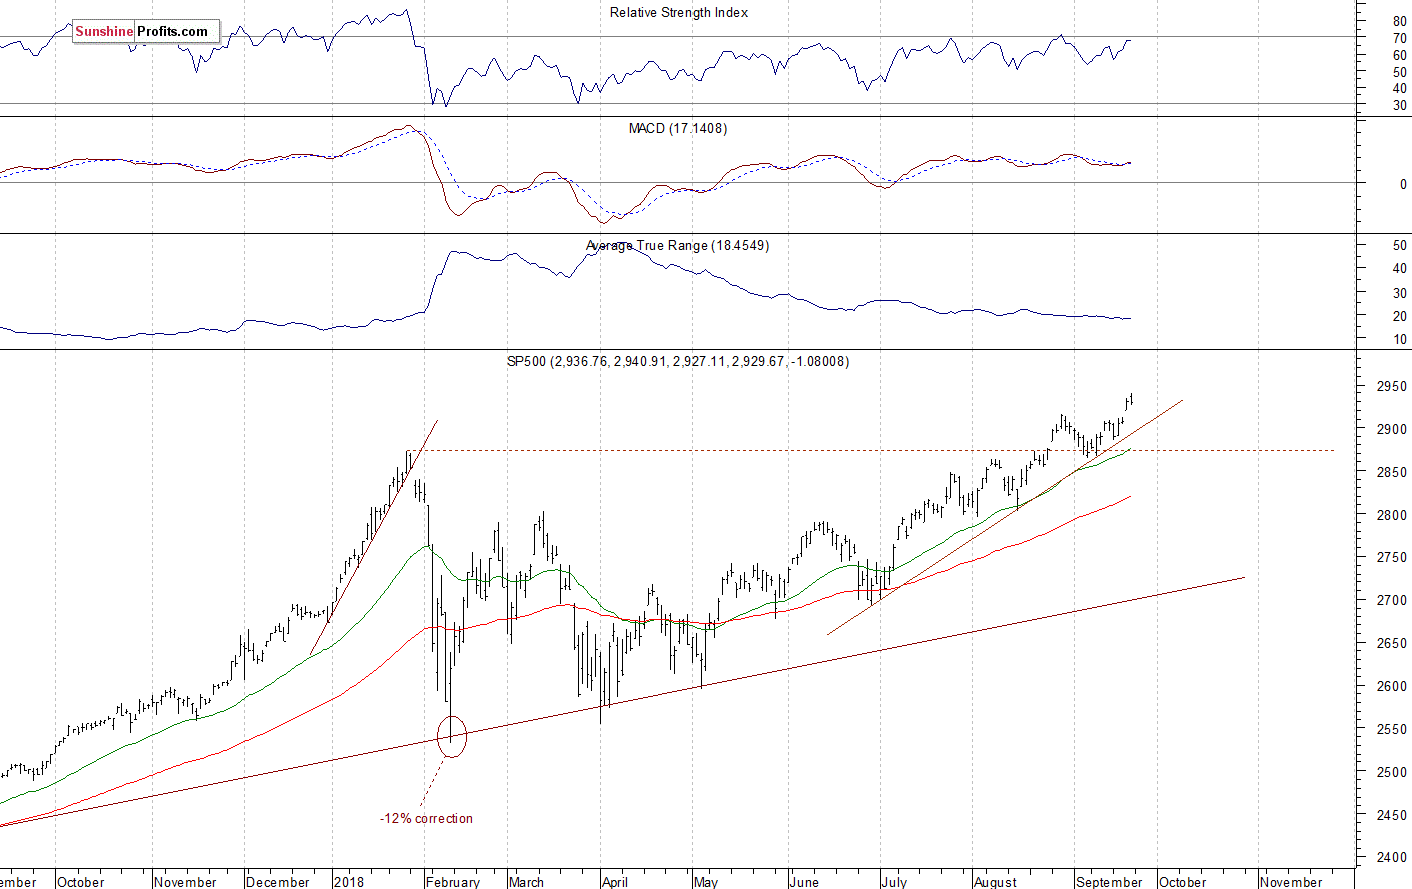
The broad stock market reached the new record high on Friday, as the S&P 500 index extended its short-term uptrend above the level of 2,900. Will it continue higher despite some short-term technical overbought conditions? There have been no confirmed negative signals so far. The index continues to trade above its three-month-long upward trend line, as we can see on the daily chart:
Downward Reversal or Just Correction?
The index futures contracts trade 0.2-0.4% below their Friday’s closing prices. So expectations before the opening of today’s trading session are slightly negative. The European stock market indexes have lost 0.1-0.2% so far. There will be no new important economic data announcements. The broad stock market will likely extend its short-term fluctuations today. We may see some more profit-taking action following the recent advance. There have been no confirmed negative signals so far.
The S&P 500 futures contract trades within an intraday consolidation following an overnight decline. The nearest important level of resistance is at 2,935-2,945, marked by the record high. On the other hand, the support level is at 2,925, marked by the local lows. The support level is also at 2,900-2,910. The futures contract is now below its week-long upward trend line, as we can see on the 15-minute chart:


Leave A Comment