
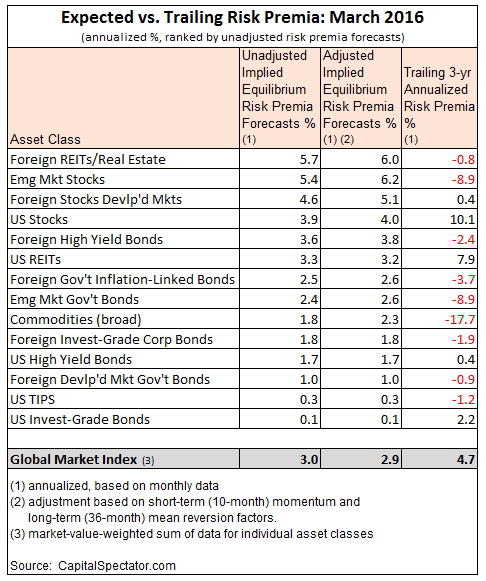
The expected risk premium for the Global Market Index (GMI) ticked higher in March—the first increase in five months. GMI—an unmanaged market-value weighted mix of the major asset classes—is projected to earn an annualized 3.0% over the “risk free” rate in the long term. (For details on the equilibrium-based methodology that’s used to generate the forecasts each month, see the summary below.) Today’s revised estimate, which is based on data through March, is slightly above last month’s projection.
Adjusting for short-term momentum and longer-term mean-reversion factors (defined below) trims GMI’s current ex ante risk premium slightly to 2.9%, based on data published through March.
GMI’s risk premia forecasts continue to remain well below the index’s realized performance in recent years, although the gap has narrowed lately in the wake of market declines. GMI earned an annualized 4.7% risk premium for the trailing 3-year period through March 2016. Based on the current projection, GMI’s implied performance in the years ahead will fall short of that return. Although any one point forecast should be viewed cautiously, recent projections suggest that multi-asset class strategies in general will experience stronger headwinds relative to the performance record in recent years.
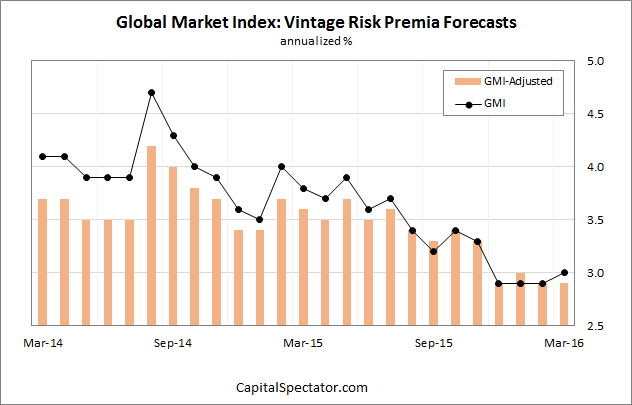
Here’s a recap of how GMI’s risk premia forecasts have evolved in recent months:
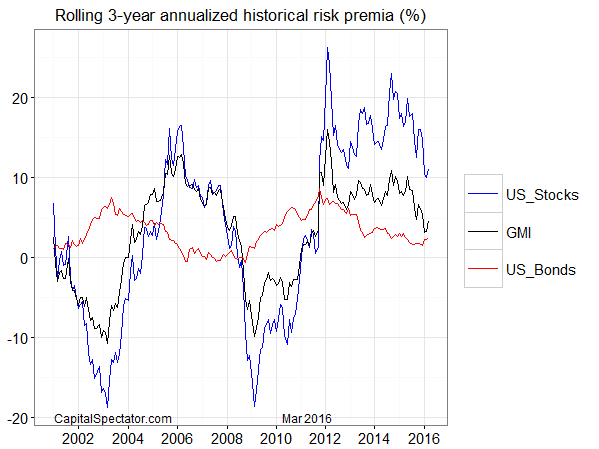
Turning to what the markets actually delivered, here’s a chart of rolling three-year annualized risk premia for GMI, US stocks (Russell 3000) and US Bonds (Barclays Aggregate Bond Index) through last month.
Finally, here’s a summary of the methodology and rationale for the estimates above. The basic idea is to reverse engineer expected return based on assumptions about risk. Rather than trying to predict return directly, this approach relies on the somewhat more reliable model of using risk metrics to estimate performance of asset classes. The process is relatively robust in the sense that forecasting risk is slightly easier than projecting return. With the necessary data in hand, we can estimate the implied risk premia using the following inputs:
? an estimate of GMI’s expected market price of risk, defined as the Sharpe ratio,
which is the ratio of risk premia to volatility (standard deviation).
? the expected volatility (standard deviation) of each asset
? the expected correlation for each asset with the overall portfolio (GMI)


Leave A Comment