
Several weekly and monthly indicators for the S&P 500 Index (SPX) are getting to levels that generally mark the top of bear market rallies. We’re sitting right at the point where the market will likely roll over or start an extremely sharp rally.
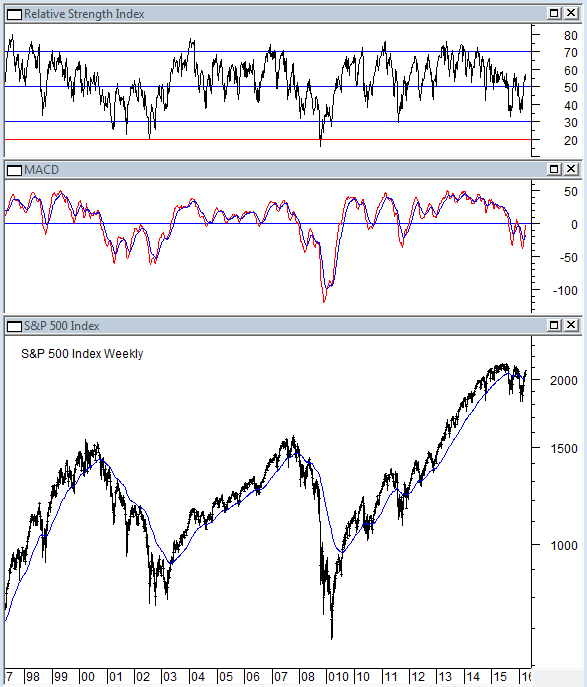
First look at the weekly chart for SPX. RSI is just below 60. This level if broken to the upside will be a good sign that we’re headed for a rally. If it turns down from here the bear market should resume. MACD is also right below zero, the level that usually constrains price during bear markets.
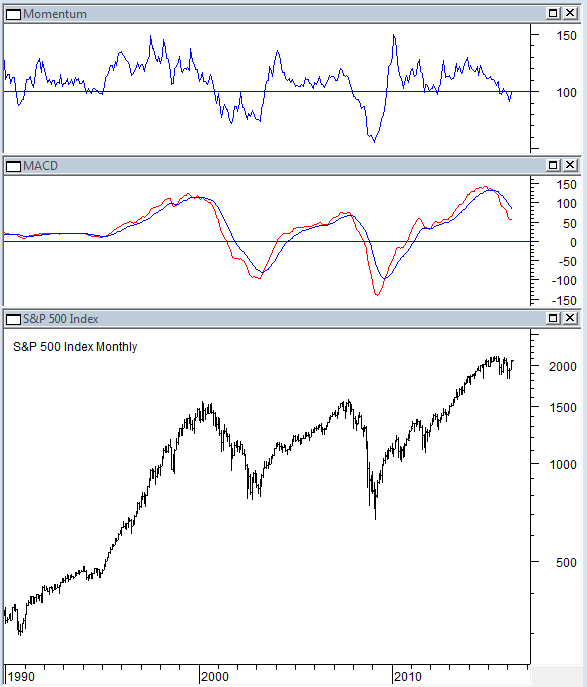
On the monthly chart for SPX momentum is back to the 100 level. If it can break through it will be another sign that the market is going to move higher. MACD on the monthly chart is trying to turn up. If it can turn up it will add weight to the rally argument.
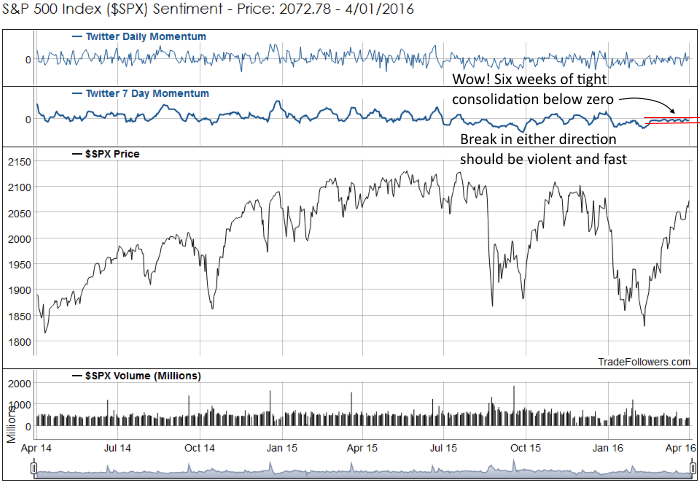
Another chart that indicates we’re at an inflection point comes from Trade Followers Twitter sentiment. It is compressing in a very tight range. When that range breaks it should be accompanied by a violent move (one way or another).
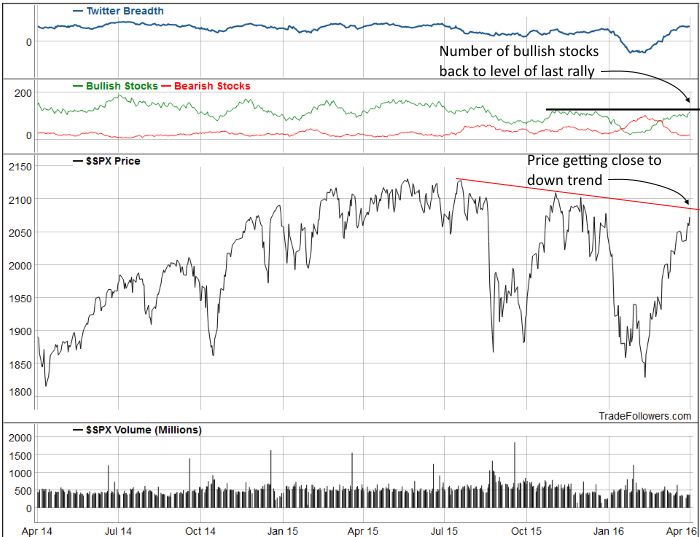
The number of bullish stocks on Twitter is back at the level of the last rally. This is happening right as price is getting close to the SPX down trend line. Both price and bullish stocks should break higher or turn over very soon.
Conclusion
The market is at an inflection point where it rolls over or rallies extremely hard (blow off top maybe). Watch the down trend line in SPX and a break in Twitter sentiment for clues for the next direction.


Leave A Comment