
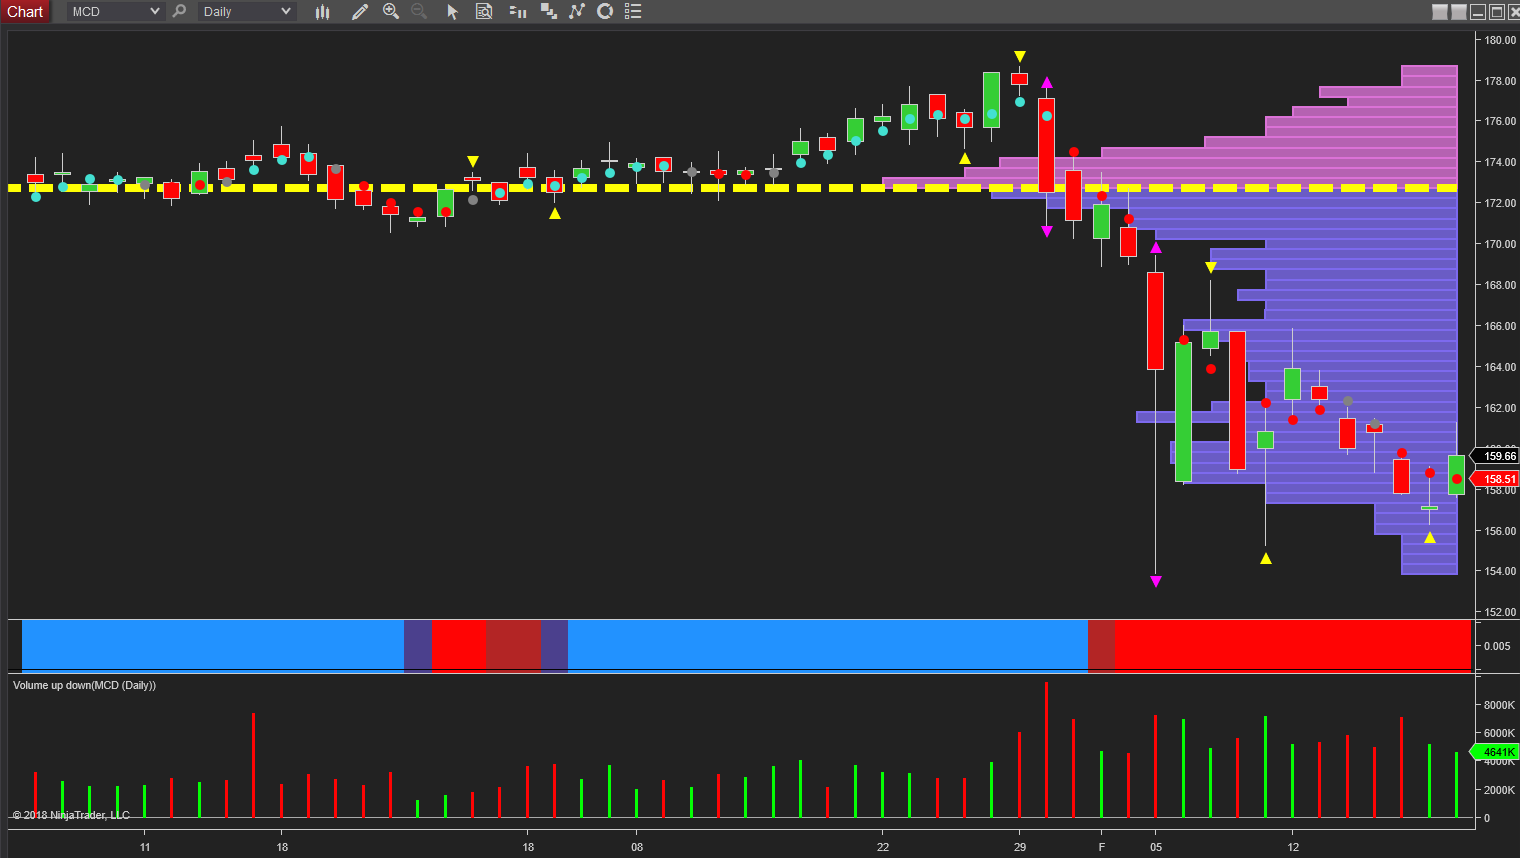
The daily chart for McDonald’s (MCD) certainly makes for some interesting reading at present, not least because unlike many other blue chip stocks, this stock has failed to follow through on the recovery in the Dow Jones and sister markets, and instead has continued lower following the aftershocks of recent volatility. And of particular interest here is the volume associated with price action, which reveals some interesting anomalies.
If we start with the initial move lower on the 30th January, the volume here is as expected with heavy selling on the widespread down candle with the stock moving $6 on the day. The following three days have seen the price move lower, before the extreme volatility of the 5th February arrives with the strong recovery later in the day generating the extreme wick to the lower body of the candle. However, note the volume, which is well below what we would expect to see, and indeed is lower than that of the 30th January, so sending a strong signal that unlike other stocks which saw sustained buying in the intraday recovery, for McDonald’s this was not the case, with the volume only high, and not extreme. So two signals here. First a clear anomaly with ‘low volume’ given the extreme price action, and second signaling a lack of buying. And it is the latter that is now reflected in the move lower, and despite attempts to rally higher over two consecutive days this was on falling volume, so confirming a lack of buying interest for McDonald’s at present.
Friday’s price action confirmed this bearish sentiment with volume rising in line with the relatively widespread down candle, with yesterday’s weak price action on the gapped down open adding further downward pressure. The support region at $155 is now coming into play, but if this is breached expect the current bearish picture to develop further in the medium term. This weak technical picture has continued in today’s trading session, with McDonald’s attempting to rally, but closing well off the highs with a deep wick to the upper body of the candle. And note the volume on the candle, it is high, and signaling further weakness ahead with the trend monitor indicator also remaining resolutely red.


Leave A Comment