
 Image Source: PexelsRussell 2000 (RTY) is close to breaking below 6.16.2022 low at 1640.70. A break below that level will open a bearish sequence from 11.8.2021 peak favoring further downside. Short term Elliott Wave View suggests that cycle from 8.1.2023 high is in progress as an impulse Elliott Wave structure. Down from 8.1.2023 high, wave 1 ended at 1832.8 and rally in wave 2 ended at 1934. The Index extended lower in wave 3 towards 1720.7 and rally in wave 4 ended at 1802.70. Wave 5 lower is currently in progress which should complete wave (1) in higher degree. Down from wave 4, wave ((i)) ended at 1724.30 and wave ((ii)) ended at 1792.90. The 45 minutes chart below shows the starting point of wave ((ii)) of 5.The Index then extended lower in wave ((iii)). Down from wave ((ii)), wave (i) ended at 1772.9 and wave (ii) ended at 1779.3. The Index extended lower in wave (iii) towards 1693.80 and rally in wave (iv) ended at 1709.70. Wave (v) lower ended at 1670.90 which completed wave ((iii)). Rally in wave ((iv)) ended at 1701.82 with internal subdivision as a zigzag. Up from wave ((iii)), wave (a) ended at 1699.70 and pullback in wave (b) ended at 1675.30. Index then extended higher in wave (c) towards 1701.82 which completed wave ((iv)). Index then resumes lower in wave ((v)). While below 1701.82, expect the Index to extend a bit lower to end wave ((v)) of C of (1). Afterwards, Index should rally in wave (2) to correct cycle from 8.1.12023 high before the decline resumes.Russell 2000 (RTY) 45 Minutes Elliott Wave Chart
 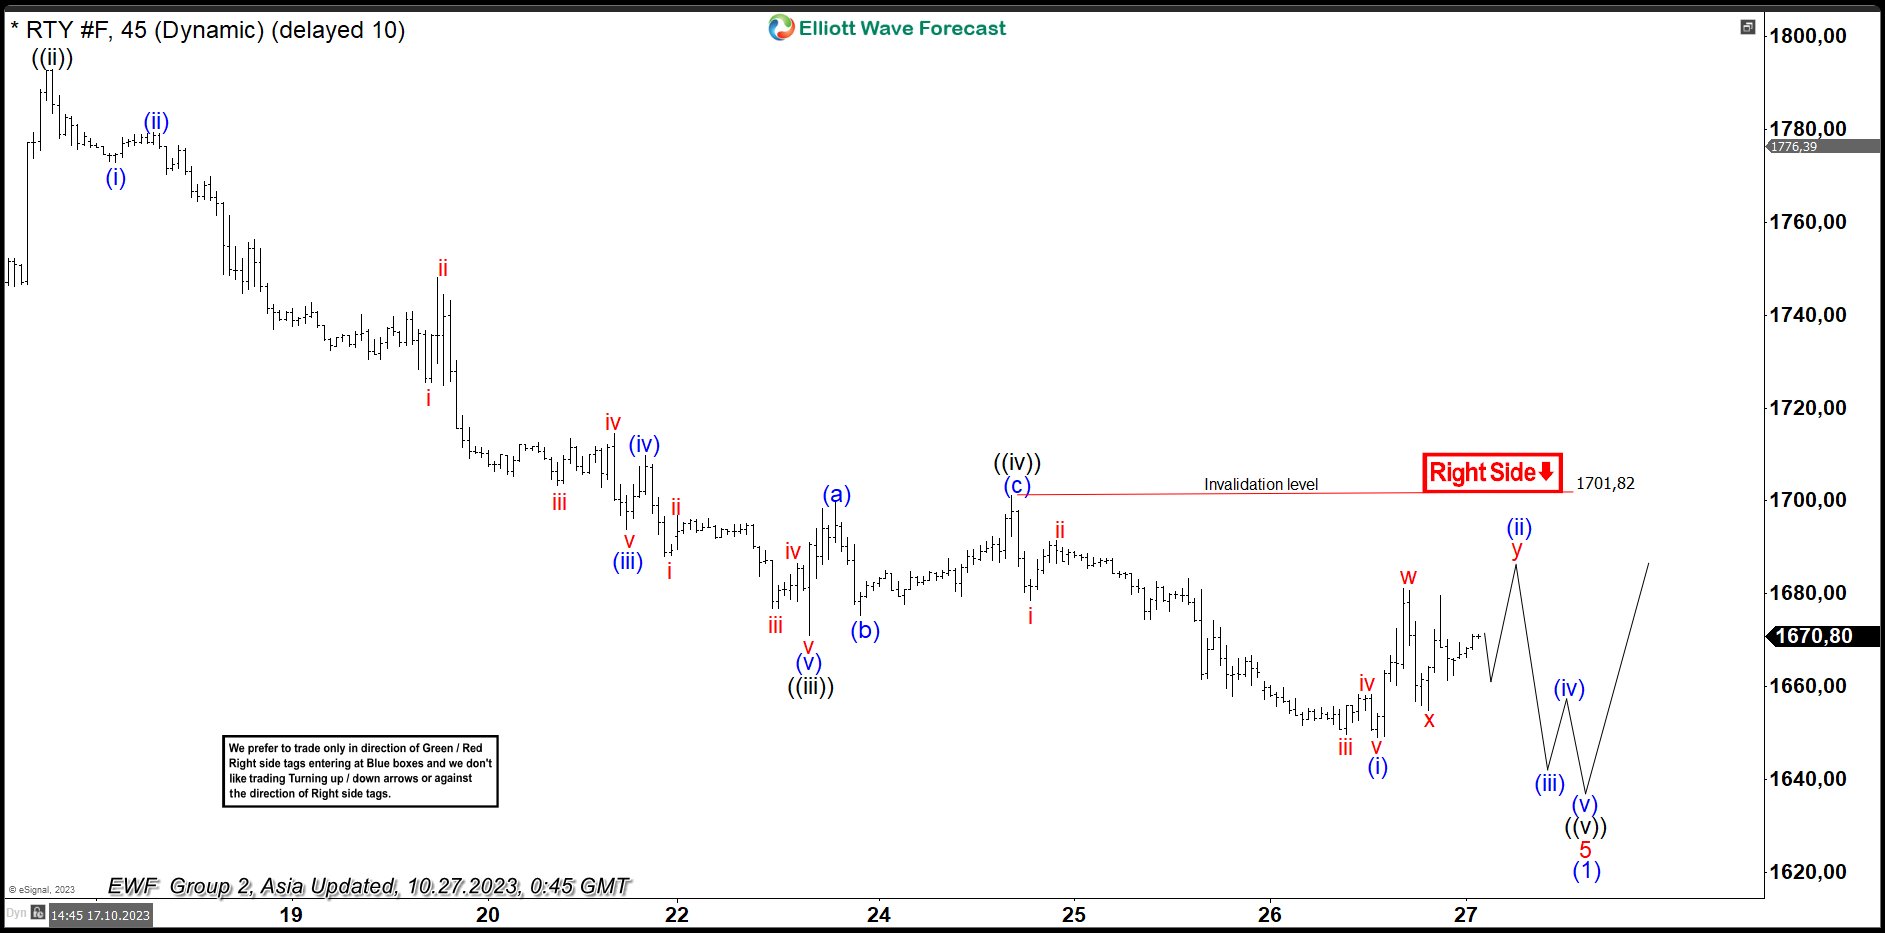 RTY Elliott Wave VideoVideo Length: 00:09:54More By This Author:EURUSD: Catching The 130 PIP 1:10 Risk/Reward Move Higher
S&P 500 Looking To End Diagonal
Bitcoin Looking To Extend Higher As Impulse


Leave A Comment