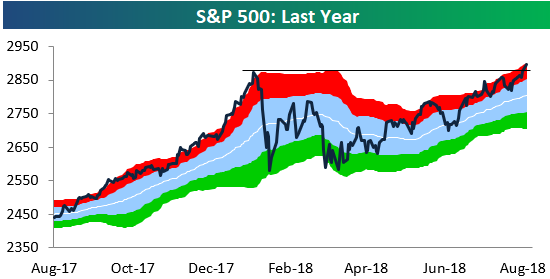
After finally closing at a new all-time high on Friday, the S&P 500 continued its push into uncharted waters with a solid gain of 80 basis points today. You can see the breakout to new highs pretty clearly in our trading range chart of the S&P 500 below.

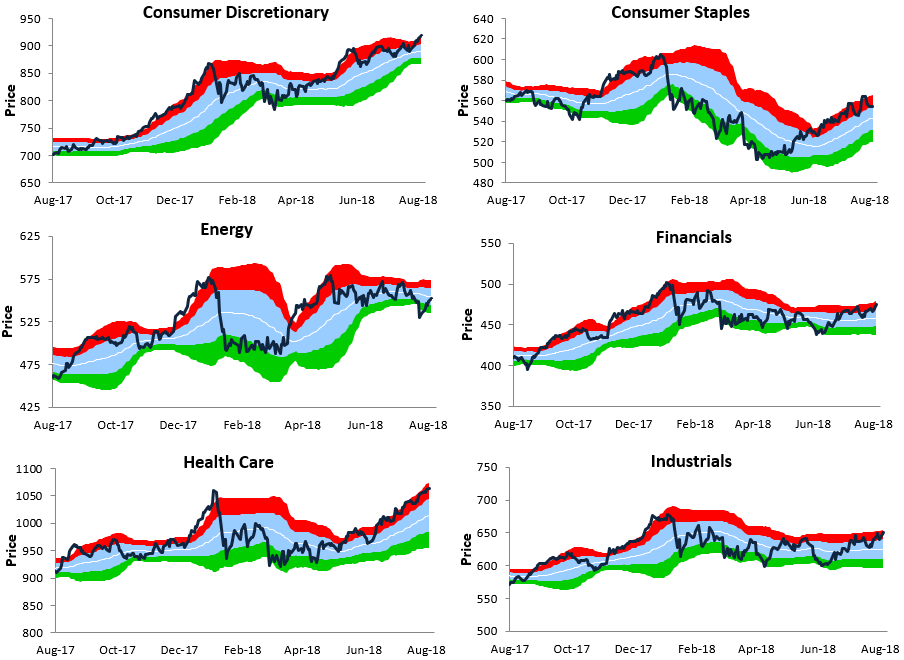
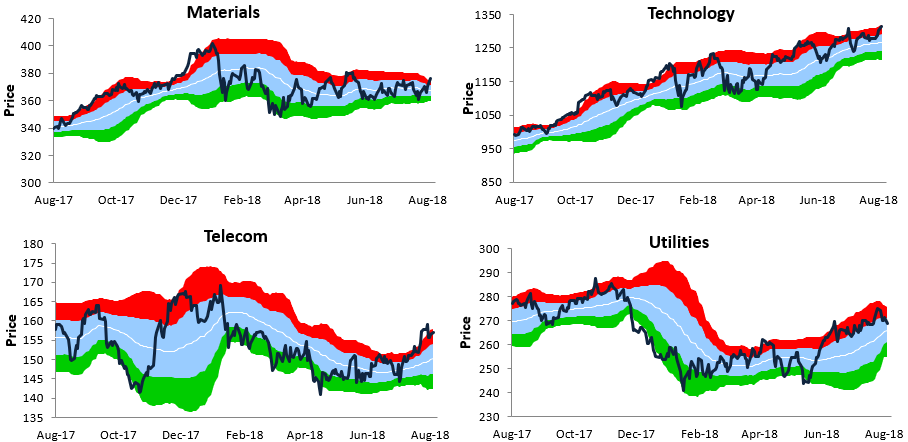
While the S&P (and most major US indices) has indeed broken out to new highs, not every area of the equity market has joined the fun. In fact, only three of the major sectors have traded to new highs along with the S&P — Consumer Discretionary, Health Care, and Technology. Below we show trading range charts for ten S&P sectors (Real Estate not included).In each chart, the white line represents the 50-day moving average, while the red and green areas represent overbought and oversold territory.
While Tech, Consumer Discretionary, and Health Care have broken out, none of the other sectors are really even that close to breaking out. Financials and Industrials are the next likely to test prior highs, but they still have a way to go.


Leave A Comment