

If you have read our previous report on equities, you would notice that most of the indices that we mentioned did move according to our plan.
Most of the global equities continued to retrace to the downside. The retracement comes just right before the earnings season. However, the geopolitical tension played the biggest role in such move.
After the recent decline in S&P500, FTSE100, and Nikkei 225, another move could be underway. We will take a look at these three indices and mention what traders should be looking at for the next few days/weeks.
S&P500 Below 50 DAY MA
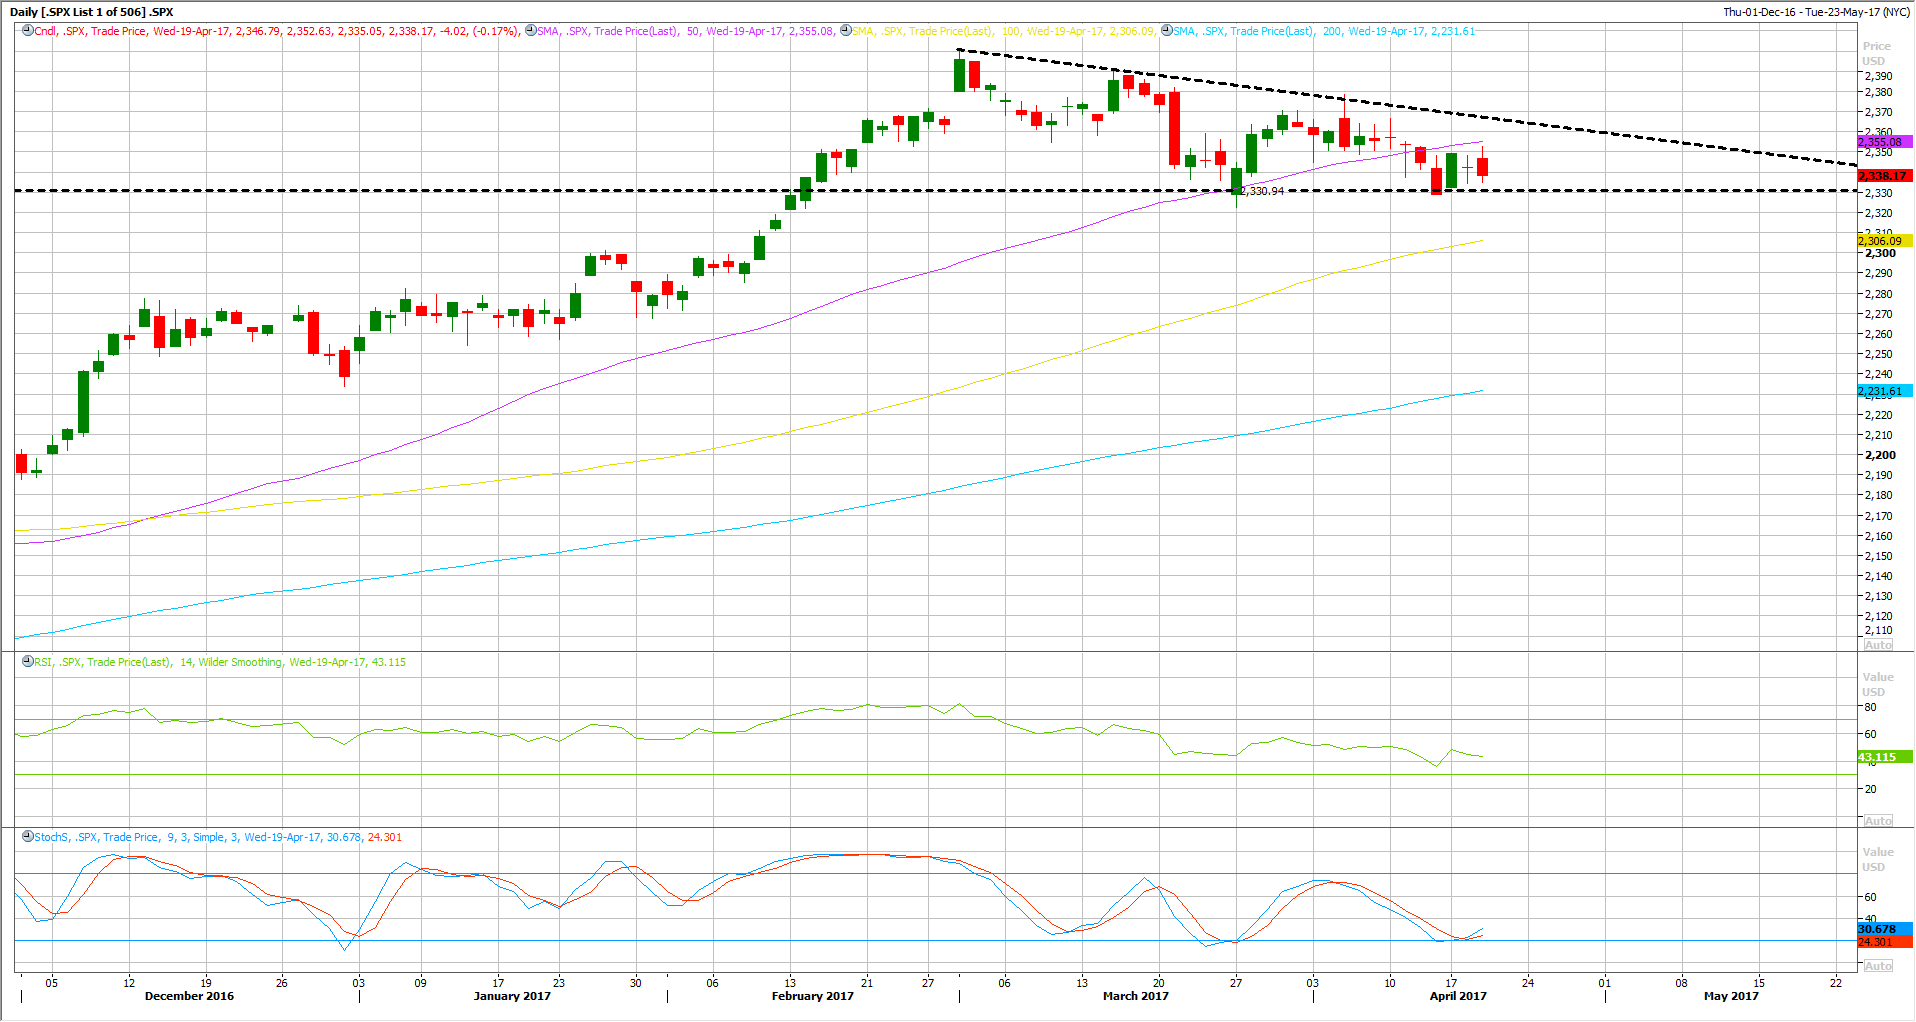
The S&P500 continued to decline further for the past two weeks, breaking below its 50 DAY MA for the first time since November of last year.
The index is trading below that MA for the past five sessions, which deepen the short-term bearish outlook.
Yet, traders should be very careful as the technical indicators are oversold and moved slightly higher; the RSI remained below the 50 Mid-point.
In the meantime, the resistance area stands at 2355, which represents the broken 50 DAY MA. A retest of that MA is possible before the downside pressure resumes.
On the downside view, the first immediate support stands at the recent lows at 2330, which should be watched very carefully, as a breakthrough that support would clear the way for further declines, probably toward 2306, which represents the 100 DAY MA.
The bearish outlook invalidation signal would be a clear break above the short-term downtrend line shown on the chart at 2367, with a daily close above that resistance.
If so, the index would probably be ready for another bull run to a new record high.
FTSE100 Tumbles After Election Announcement

At the beginning of the week, there were some technical signs of a downward retracement on FTSE100. The index was trading above its 50 DAY MA, tried to a breakthrough that support but without any chance.


Leave A Comment