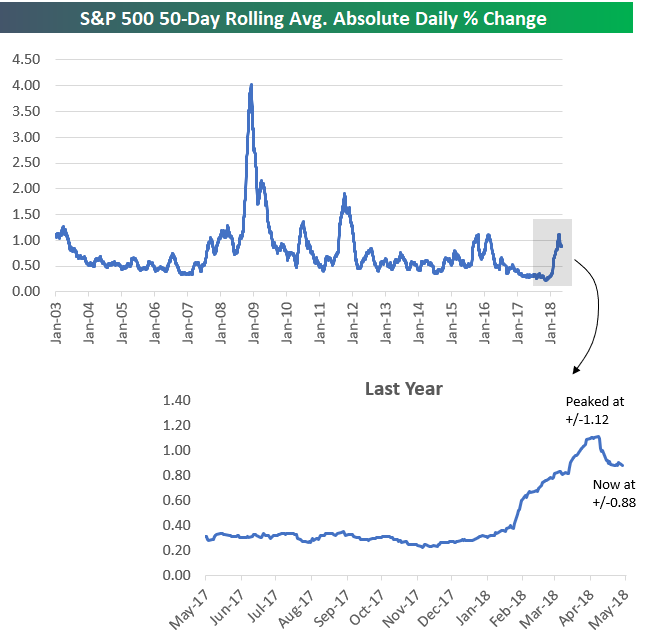
As you may have noticed, market volatility has begun to cool a bit in recent weeks. While we wouldn’t go as far as famed investor Jack Bogle did when he said recently that it’s the most volatile market he’s seen in his career, the action over the first few months of 2018 was certainly a lot more hectic than it was in 2017. At one point last year, the S&P 500’s average absolute daily % change over a 50-trading day period got as low as 0.22%! At its highs recently on April 16th, the S&P had averaged a daily absolute change of +/-1.12% over the prior 50 trading days.
Below is a chart showing the S&P’s 50-day rolling average absolute daily % change going back to 2003. The most recent period ended up trading more volatile than the action we saw in 2015/2016, but it wasn’t nearly as volatile as late 2011 when the S&P averaged a daily move of +/-1.98% over a 50-day period.
Of course, nothing since the Great Depression can compare to the volatility seen at the height of the Financial Crisis. At one point in late 2008, the S&P had averaged a DAILY move of +/-4.02% over a 50 trading day period. Now THAT is what you call “the most volatile market you’ve ever seen!”
Getting back to the current market environment, after peaking at +/-1.12% in mid-April, the S&P’s average daily change over the last 50 days has dipped down to +/-0.88%. While it may feel like things have calmed down, +/-0.88% is still 4x greater than what investors were used to in 2017.


Leave A Comment