Our benchmark S&P 500 surged at the open, rising to an unusually narrow trading range for the rest of the session. It closed with a 1.45% advance, returning to rally mode after a two-session pause. The index is out of the correction zone, now down only 8.70% from its record close last May. Today’s gain came on low volume. The preliminary data at Stockcharts.com shows the second lowest trading volume of 2016.
The yield on the 10-year note closed at 1.77%, up 1 basis point from the previous close.
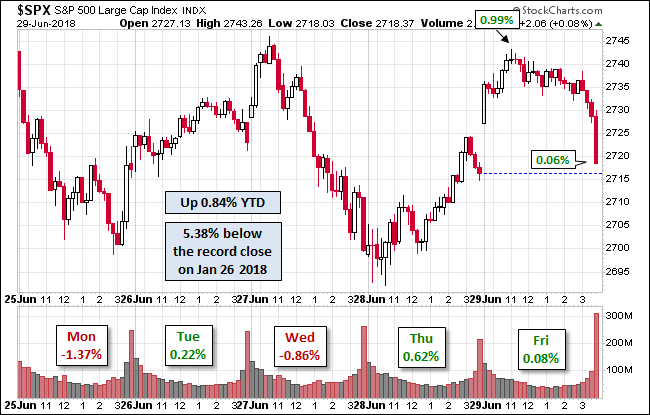
Here is a snapshot of past five sessions.

Here is a daily chart of the SPY ETF, which gives a better sense of investor participation (or lack thereof) over the past six sessions. Today’s volume was the lowest of the year.

A Perspective on Drawdowns
Here’s a snapshot of selloffs since the 2009 trough.

A Perspective on Volatility
For a sense of the correlation between the closing price and intraday volatility, the chart below overlays the S&P 500 since 2007 with the intraday price range. We’ve also included a 20-day moving average to help identify trends in volatility.

Here is the same chart with the 50- and 200-day moving averages.


Related Posts
 USDCAD Weekly Analysis – Sunday, Sept.16
- Zambia raises 2010 GDP forecast to 6.6%
- Wait, Blackrock Is Saying What?
 WTI Crude Tumbles To $44 Handle (As Algos Forget US Closed)
- Angel investors vs. venture capitalists
 Yellen Says Asset Prices Are ‘High’, Draghi Says ‘People’ Still Aware That Stocks Sometimes Fall


Leave A Comment