Our benchmark S&P 500 opened a hair lower than Friday’s close and sold off to its -0.31% intraday low about 90 minutes later. It then slowly recovered in zigzag fashion to its 0.21% afternoon high before drifting downward to its fractional closing gain of 0.10%. Today’s session was the narrowest intraday trading range of the year. In fact, the four lowest intraday ranges of the 54 sessions in 2016 have occurred over the last 6 market days. Only Fed Wednesday and the post-Fed reaction on Thursday were a bit higher, at the 25% and 30% percentile, respectively.
The yield on the 10-year note closed at 1.92%, up four basis points from the previous close.
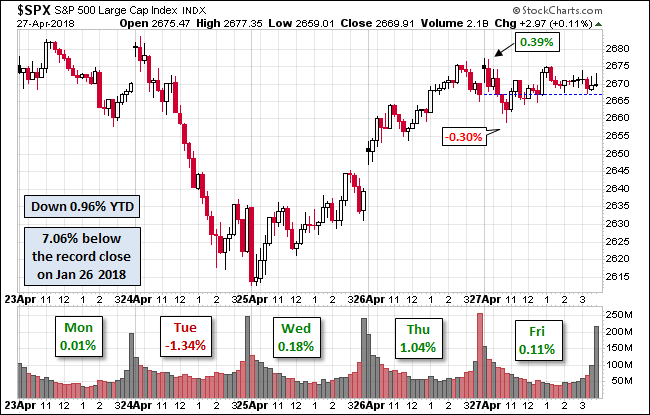
Here is a snapshot of past five sessions in the S&P 500.

Here is a daily chart of the SPY ETF, which gives a better sense of investor particpation than the underlying index. Volume has been relatively light during this rally off the interim low on February 11. Today’s fractional gain came on the lowest volume of the year.

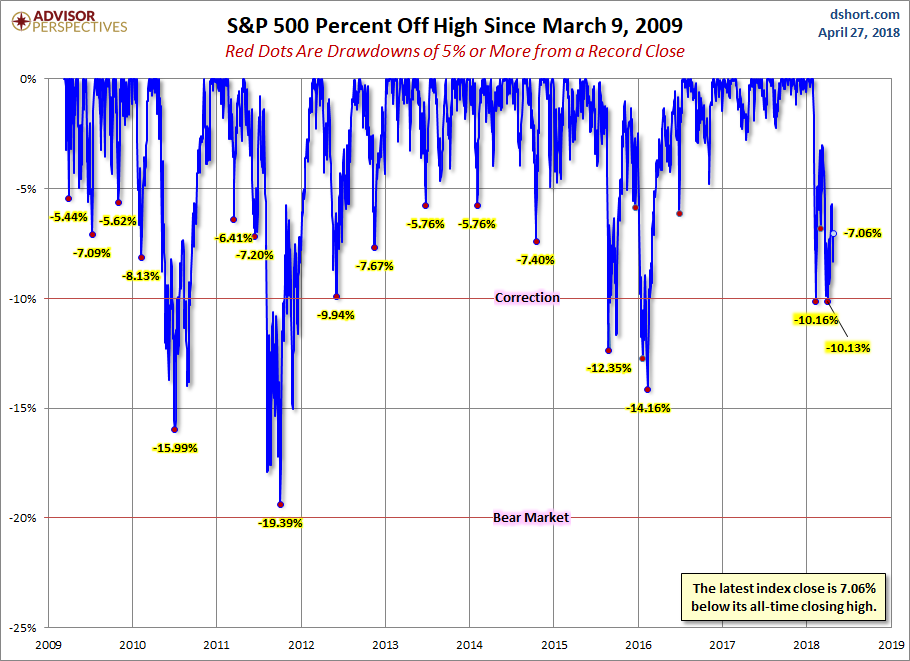
A Perspective on Drawdowns
Here’s a snapshot of selloffs since the 2009 trough.
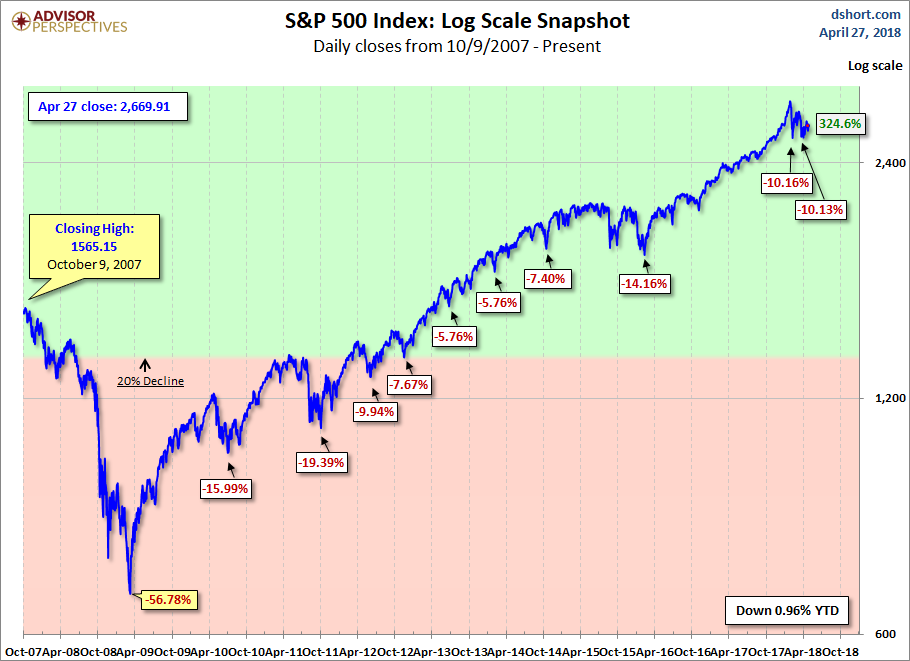
Here is a more conventional log-scale chart with drawdowns highlighted.
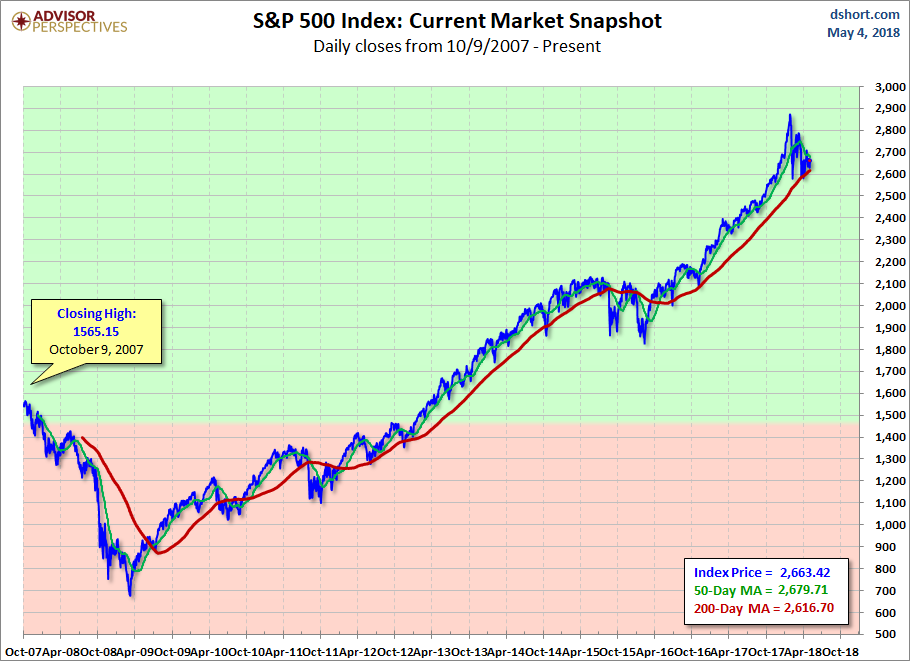
Here is a linear scale version of the same chart with the 50- and 200-day moving averages.
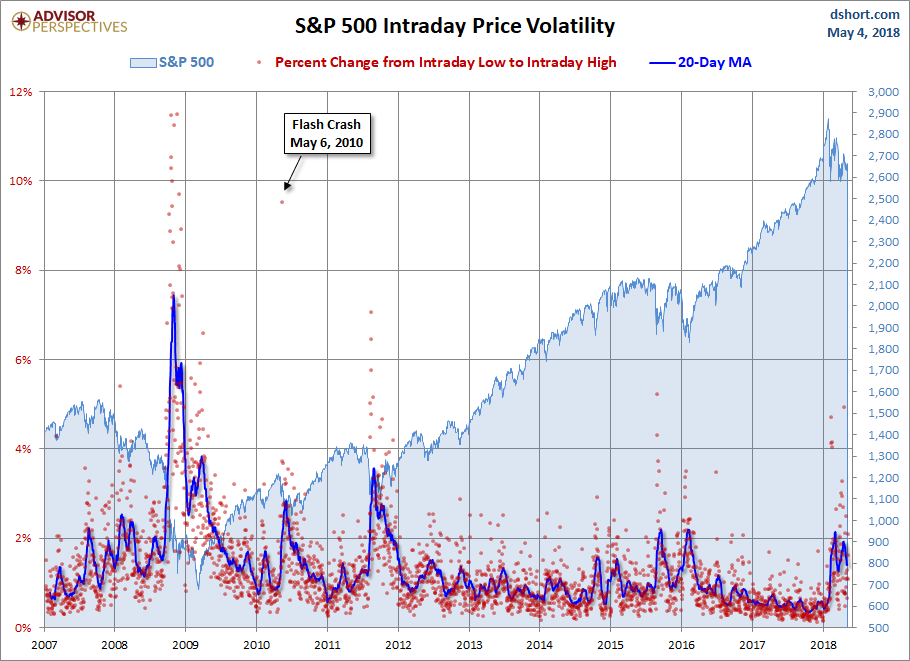
A Perspective on Volatility
For a sense of the correlation between the closing price and intraday volatility, the chart below overlays the S&P 500 since 2007 with the intraday price range. We’ve also included a 20-day moving average to help identify trends in volatility.


Leave A Comment