
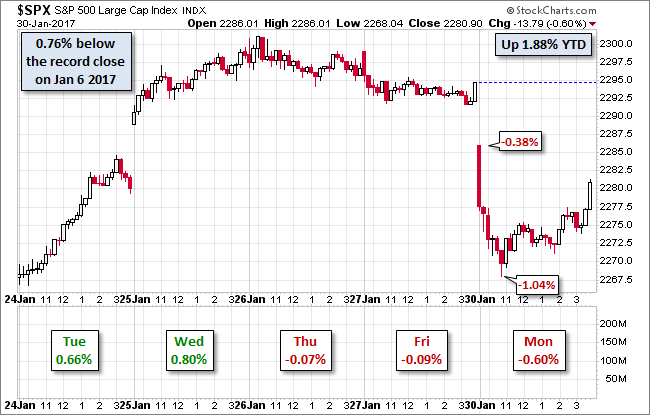
Markets around the globe continued in selling mode today, with Japan’s Nikkei falling 1.79% and Germany’s DAX dropping 1.25%, although the broader European measure, the STOXX 600 Index closed with a smaller decline of 0.67%. At the open, the S&P 500 looked to resume yesterday’s sell-off, opening lower and falling to its -0.60% intraday low in the late morning. It then traded in a narrow range until 2 PM, at which point it rallied steadily to a trimmed loss of 0.09%, a tick off the -0.08% intraday high. However, the 500 closed the month with a 1.79% gain.
Here is a snapshot of the past five sessions in the S&P 500.
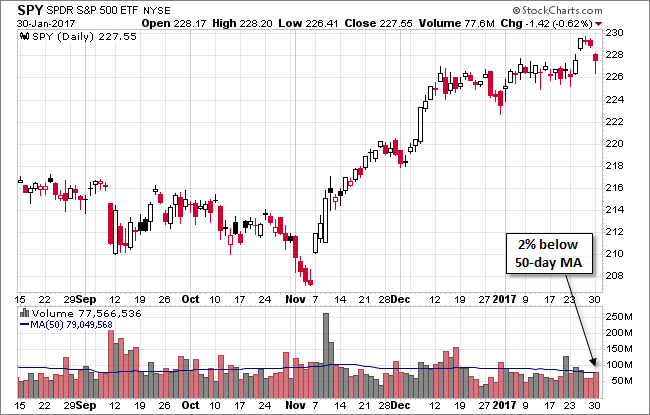
The U.S. Treasury puts the closing yield on the 10-year note at 2.45%, down four BPs from the previous close.
Here is a daily chart the Index, where we can see a bit of a head fake over the past few sessions.
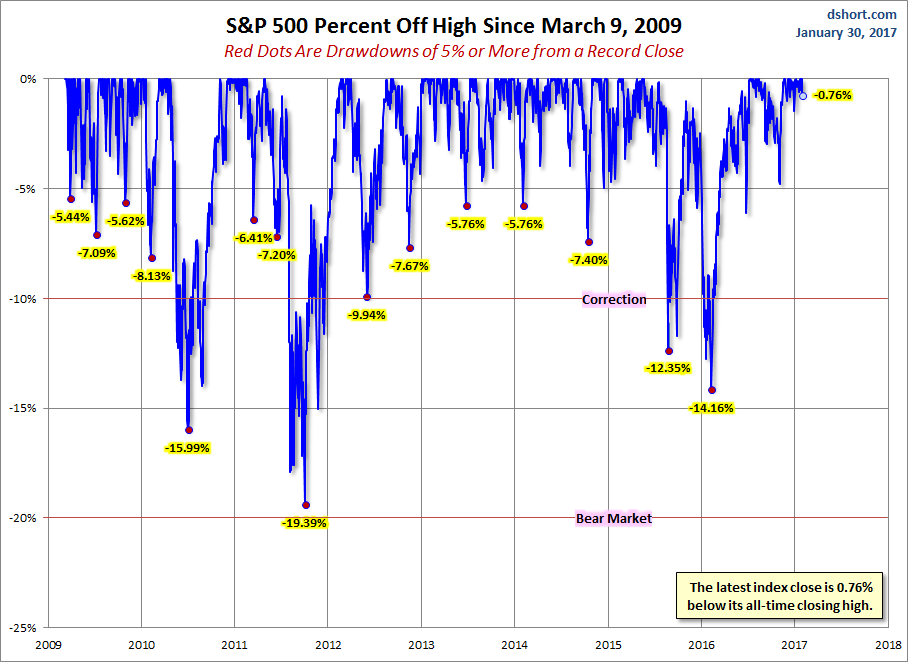
A Perspective on Drawdowns
Here’s a snapshot of record highs and selloffs since the 2009 trough.
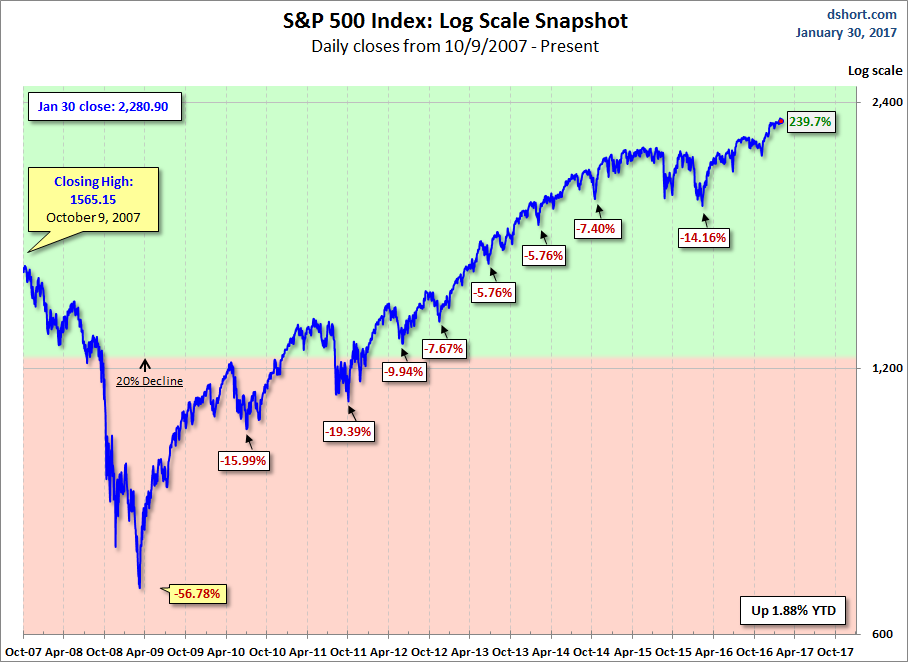
Here is a more conventional log-scale chart with drawdowns highlighted.
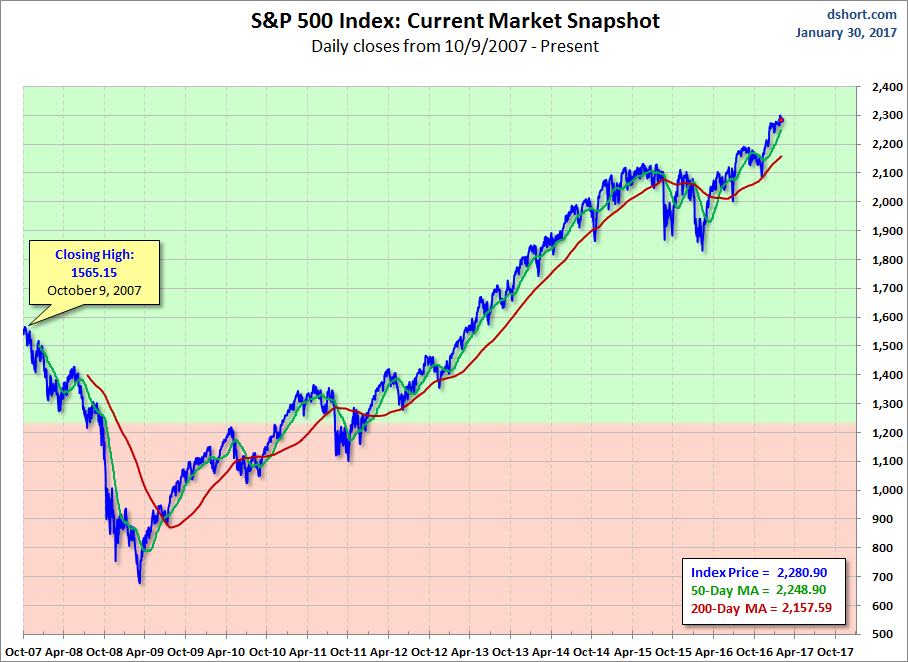
Here is a linear scale version of the same chart with the 50- and 200-day moving averages.
A Perspective on Volatility
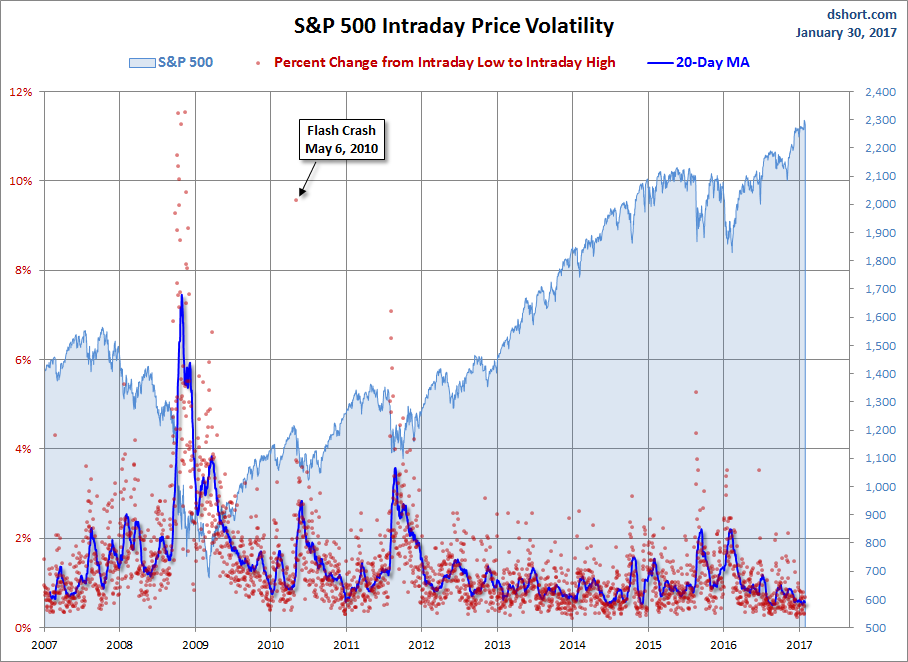
For a sense of the correlation between the closing price and intraday volatility, the chart below overlays the S&P 500 since 2007 with the intraday price range. We’ve also included a 20-day moving average to help identify trends in volatility.


Leave A Comment