
The S&P 500 bounced back after yesterday’s 1.12% decline that ended a five-day rally. The index opened posted some early gains before dipping to its 0.03% mid-morning low and then rose to its 0.68% intraday high just before the lunch hour. It then oscillated a couple of times to its trimmed closing gain of 0.51%. The 0.65% intraday range was the smallest of 2016. The index appears to be forming a flag over the past four sessions, creating an aura of suspense. Will tomorrow see a breakout or breakdown?
The treasury market was skeptical of today’s equity gain. The yield on the 10-year note closed at 1.90%, up seven basis points from the previous close.
Here is a snapshot of past five sessions in the S&P 500.

Here is a daily chart of the SPY ETF, which gives a better sense of investor participation in today’s action. Volume (the lowest of the year) suggests that many investors are taking a “wait and see” attitude.

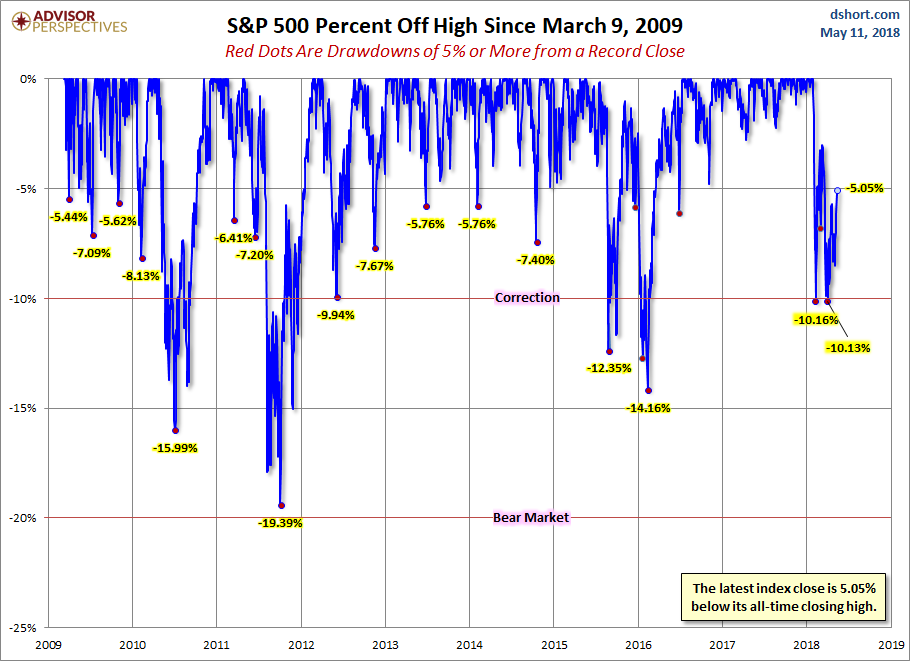
A Perspective on Drawdowns
Here’s a snapshot of selloffs since the 2009 trough.
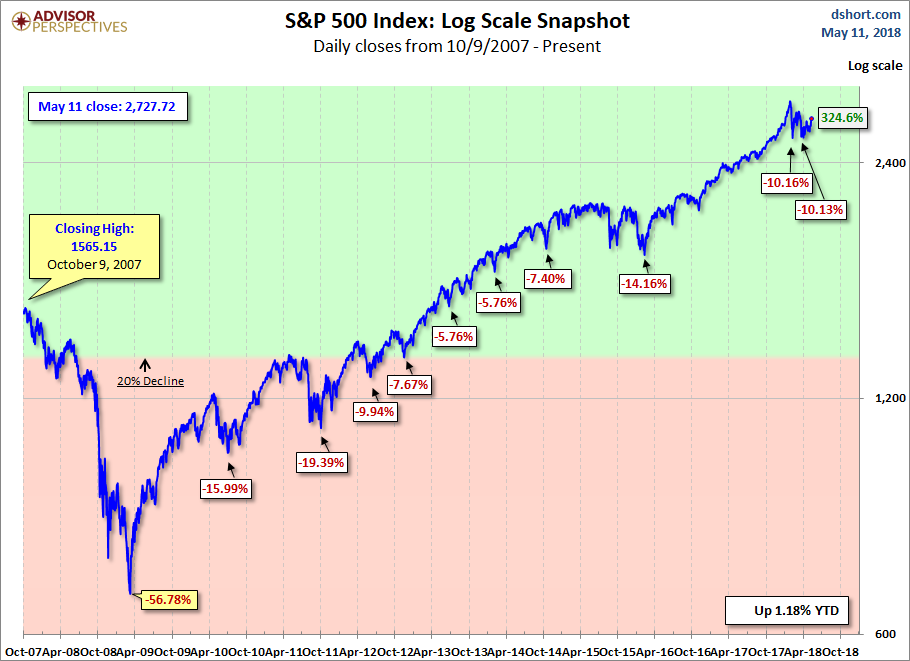
Here is a more conventional log-scale chart with drawdowns highlighted.
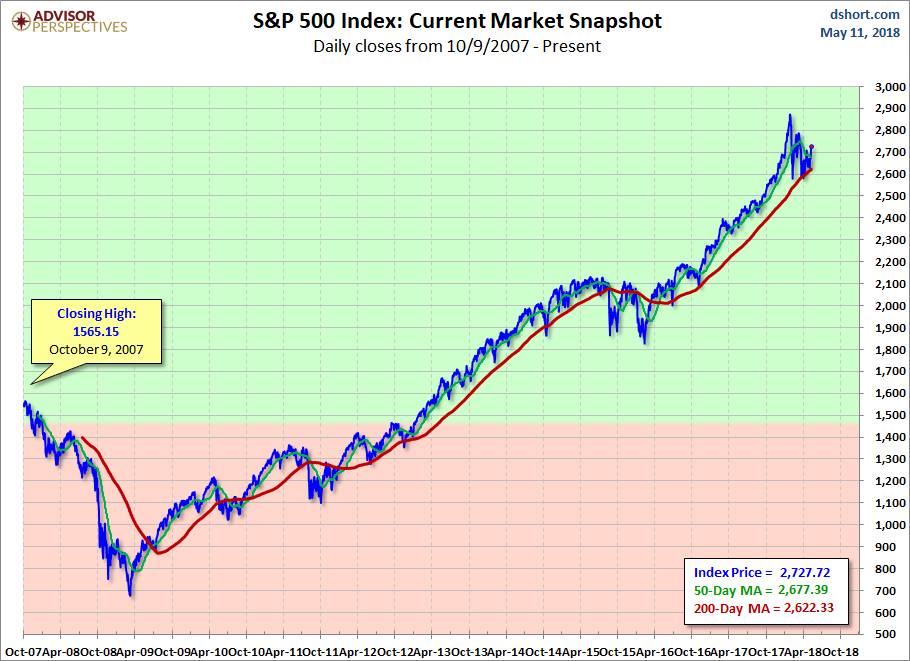
Here is a linear scale version of the same chart with the 50- and 200-day moving averages.
A Perspective on Volatility
For a sense of the correlation between the closing price and intraday volatility, the chart below overlays the S&P 500 since 2007 with the intraday price range. We’ve also included a 20-day moving average to help identify trends in volatility.


Leave A Comment