Equity markets around the world opened the week in a subdued mode. For example, the Shanghai Composite fell 0.56% and the Euro STOXX 50 slipped 0.21%. The S&P 500 showed some indecision at the open and then rallied to its modest 0.31% intraday high near the end of the opening hour. It then sold off slowly through the lunch hour and then at an accelerating rate to its -0.37% mid-afternoon low. The index trimmed the loss to -0.12% at the close.
The yield on the 2-year note closed at 0.93%, up 1 bp from Friday and its highest level since early May of 2010. The 10-year note dropped 1 bp to 2.25%.
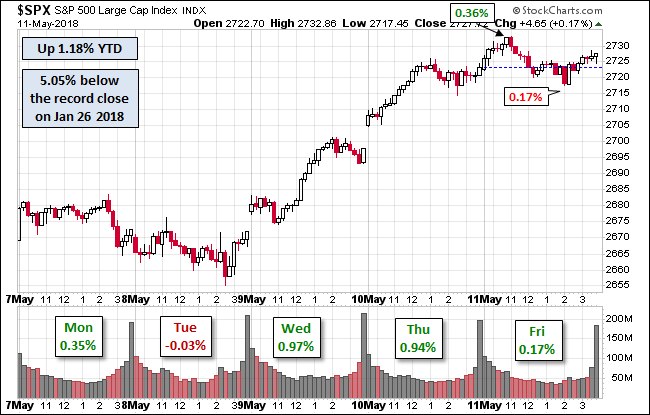
Here is a snapshot of past five sessions.

Here is a daily chart of the S&P 500. Volume at the start of Thanksgiving week was subued.

A Perspective on Drawdowns
Here’s a snapshot of selloffs since the 2009 trough.

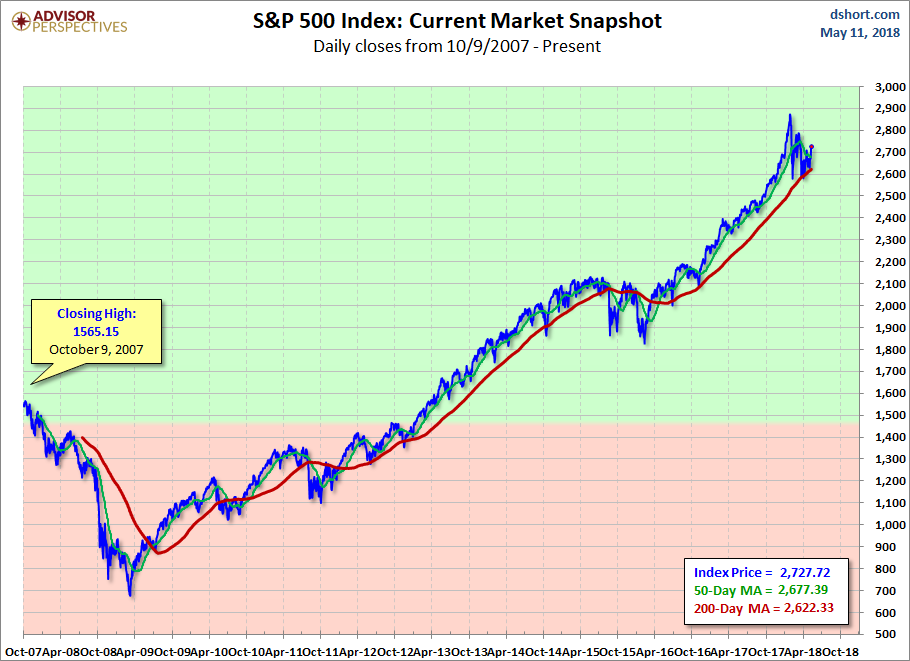
For a longer-term perspective, here is a log-scale chart base on daily closes since the all-time high prior to the Great Recession.

Here is the same chart with the 50- and 200-day moving averages. The 50 crossed below the 200 on August 28th.


Leave A Comment