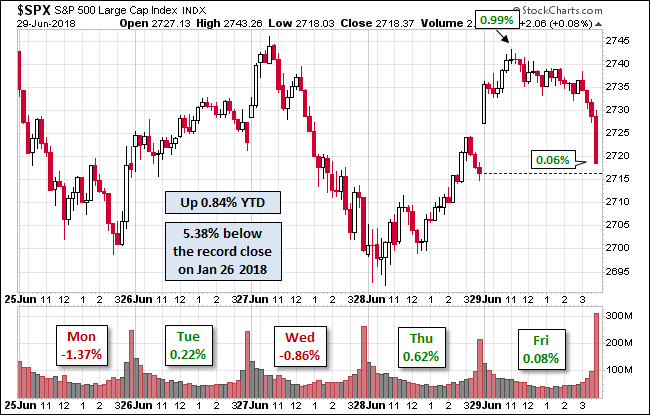
Bummer! Our benchmark S&P 500 was on the verge of setting a full week of record closes, but today’s fractional 0.09% decline ended the streak at four days. The index hit is 0.24% intraday high about two minutes into the session. It then sold off to its -0.34% intraday low during the lunch hour. A slow recovery created a late session mini-drama: Would the index go five for five on record closes? But alas it was not to be. Interestingly enough, a week with four record closes and one microscopic loss posted a weekly advance of only 1.49%.
The yield on the 10-year note climbed seven basis points to close at 1.60%.
Here is a snapshot of past five sessions in the S&P 500.

Here is a daily chart of the S&P 500. The preliminary read on rading volume was 13% below its 50-day moving average. That’s remarkably low for an options Friday.

A Perspective on Drawdowns
Here’s a snapshot of selloffs since the 2009 trough.

Here is a more conventional log-scale chart with drawdowns highlighted.

Here is a linear scale version of the same chart with the 50- and 200-day moving averages.

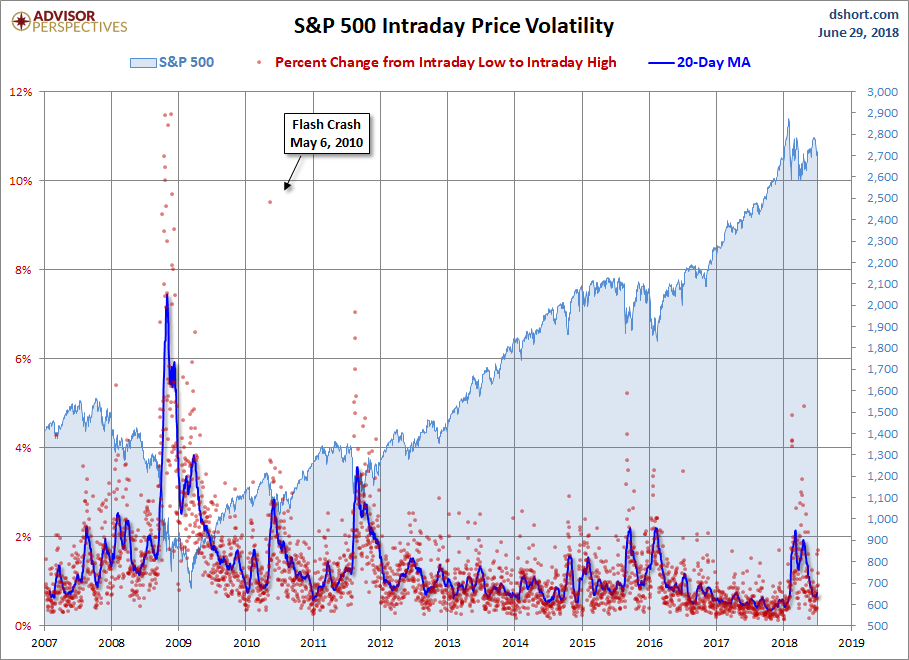
A Perspective on Volatility
For a sense of the correlation between the closing price and intraday volatility, the chart below overlays the S&P 500 since 2007 with the intraday price range. We’ve also included a 20-day moving average to help identify trends in volatility.


Leave A Comment