
US equity markets had seriously bad day today with our benchmark S&P 500 slipping back into the red year-to-date at -0.63%. The index plunged at the open, made a half-hearted recovery attempt and then sold off in a couple of waves to its -1.40% close, just a hair off its intraday low. The popular financial press laid the blame variously to the selloff in oil, with WTIC dropping about 3%, and more unified Fed-speak, even from the doves, about a near-term rate hike.
The yield on the 10-year note closed at 2.32%, unchanged from its Tuesday close (the bond market being closed yesterday in commemoration of Veterans Day).
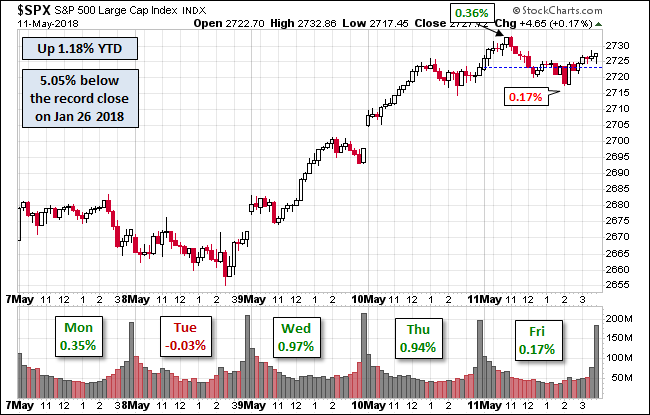
Here is a snapshot of past five sessions.

Here is a daily chart of the index. Volume was unremarkable, but we see the the price closed below its 200-day moving average.
A Perspective on Drawdowns
Here’s a snapshot of selloffs since the 2009 trough.

For a longer-term perspective, here is a log-scale chart base on daily closes since the all-time high prior to the Great Recession.

Here is the same chart with the 50- and 200-day moving averages. The 50 crossed below the 200 on August 28th.


Leave A Comment