European indexes were having a bad day when the US markets opened. The Euro STOXX 50 would ultimately close with a 1.26% loss, and the FTSE would drop a more dramatic 1.86%. Our benchmark S&P 500 plunged at the open and hit its -1.06% intraday low about 90 minutes later. During the lunch hour the index began a slow struggle higher and ended the session with a 0.37% loss, thus trimming about two-thirds off the late morning low. The S&P 500 is back in the red year-to-date at -0.19% after 27 sessions in the green.
The yield on the 10-year note closed at 1.85%, down two basis points from the previous close.
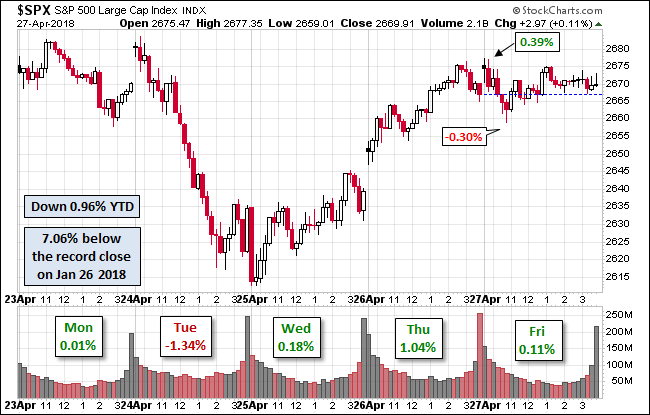
Here is a snapshot of past five sessions in the S&P 500.

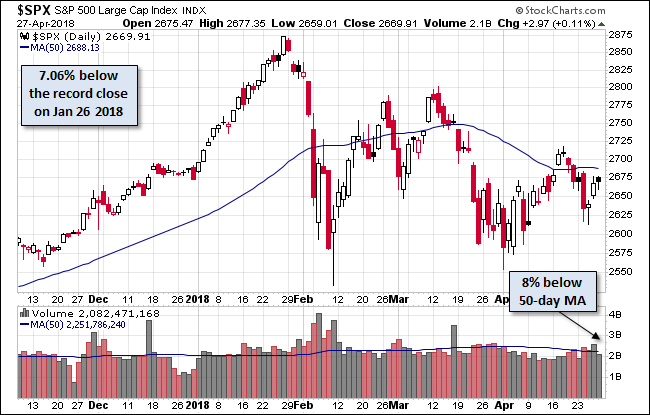
On the daily chart we see the participation was on a bit above the 50-day moving average.
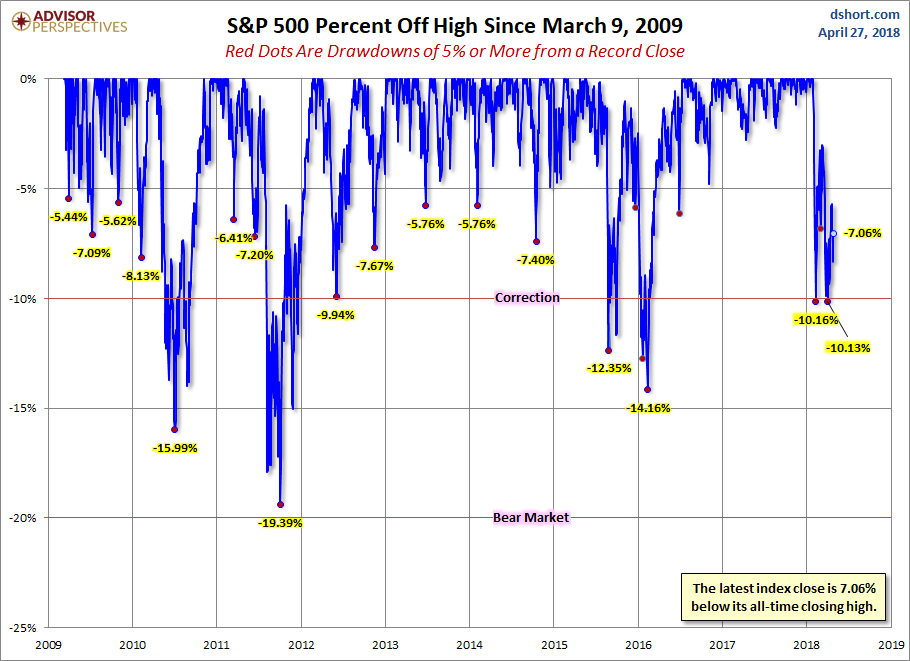
A Perspective on Drawdowns
Here’s a snapshot of selloffs since the 2009 trough.
Here is a more conventional log-scale chart with drawdowns highlighted.
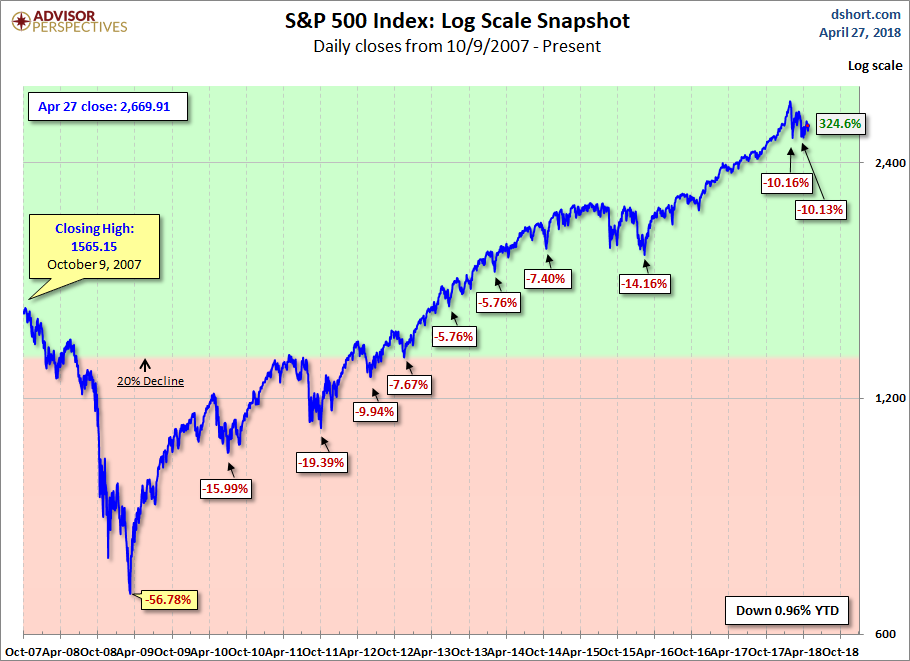
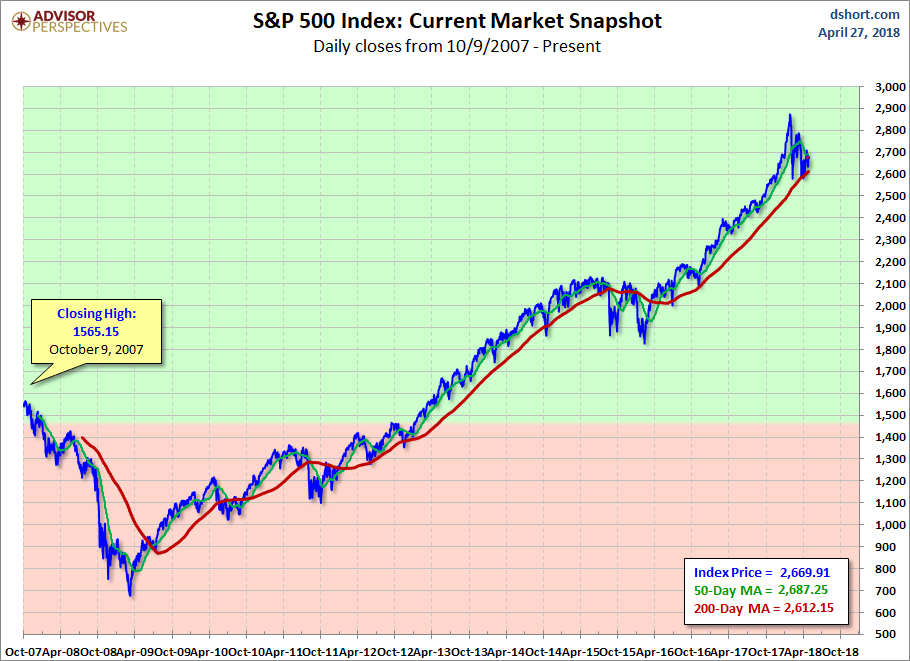
Here is a linear scale version of the same chart with the 50- and 200-day moving averages.
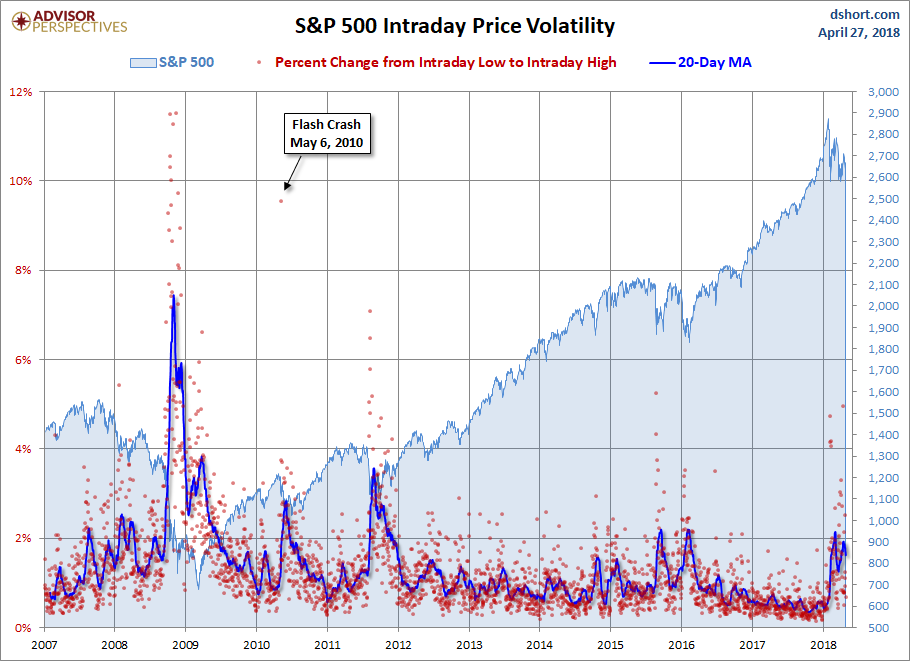
A Perspective on Volatility
For a sense of the correlation between the closing price and intraday volatility, the chart below overlays the S&P 500 since 2007 with the intraday price range. We’ve also included a 20-day moving average to help identify trends in volatility.


Leave A Comment