
The S&P 500 sank at the open, traded sideways to the noon hour and then sold off in a couple of waves to its -1.25% intraday low early in the final hour some buying in the final 30 minutes lifted the final loss to -0.94%, which erased virtually all of Monday’s 0.98% rally. This morning’s economic news was a mixed bag: Fewer than expected building permits, moderate CPI, a beat on housing starts and a welcome rise in Industrial Production, which has been in recessionary doldrums. Today’s selloff comes in advance of tomorrow’s release of the minutes for the April 26-27 FOMC meeting.
The index is now up only 0.16% year-to-dayte. As for the old “sell in May” adage, after twelve sessions, the index is down 0.9% for the month.
The yield on the 10-year note closed at 1.76%, up only one basis point from the previous close.
Here is a snapshot of past five sessions in the S&P 500.

Here is a daily chart of the S&P 500. At today’s close the index had fallen back below its 50-day moving average. Trading volume on today’s ticked up a bit on today’s selling.

A Perspective on Drawdowns
Here’s a snapshot of selloffs since the 2009 trough.
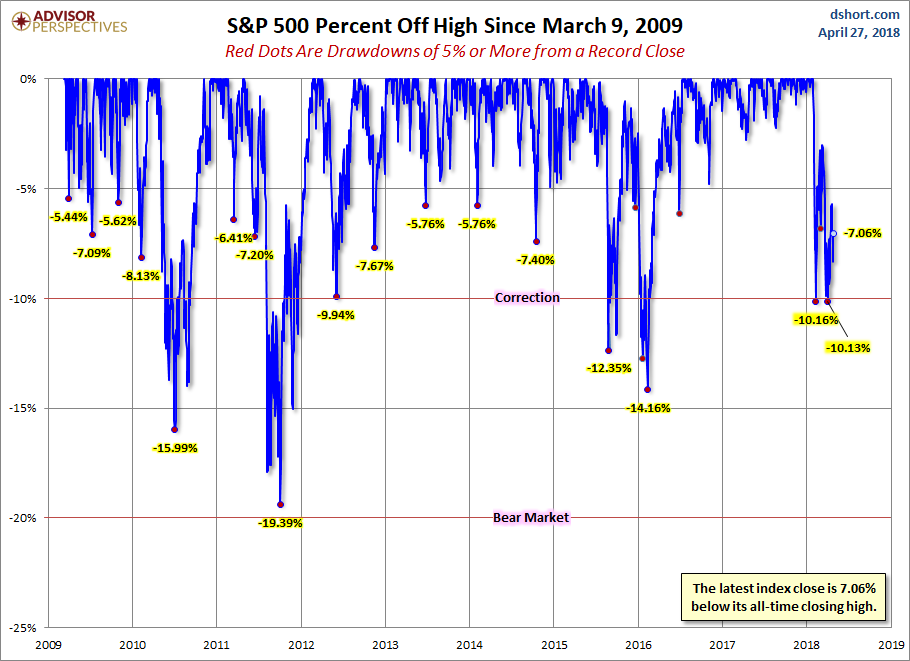
Here is a more conventional log-scale chart with drawdowns highlighted.

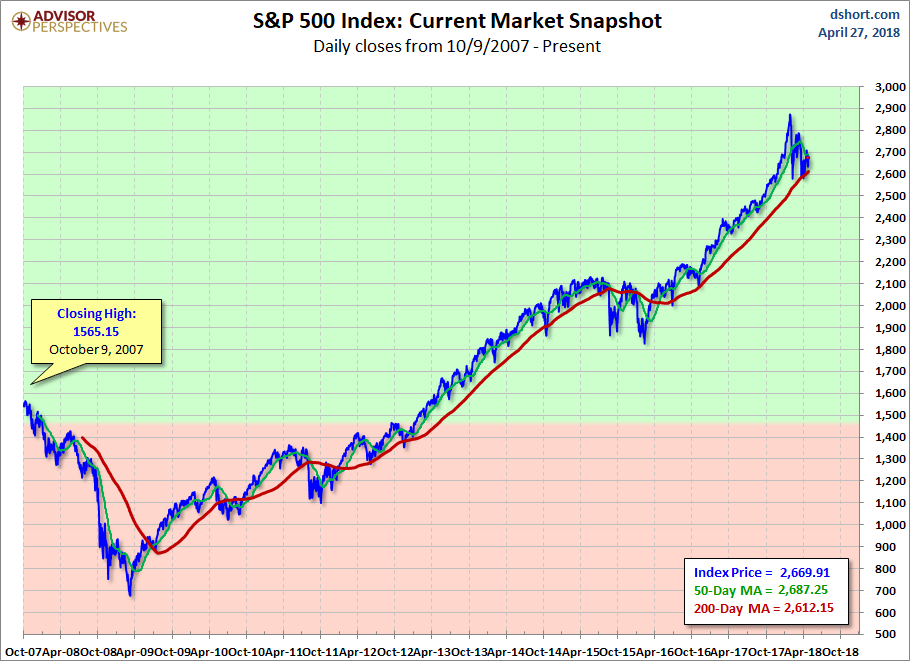
Here is a linear scale version of the same chart with the 50- and 200-day moving averages.
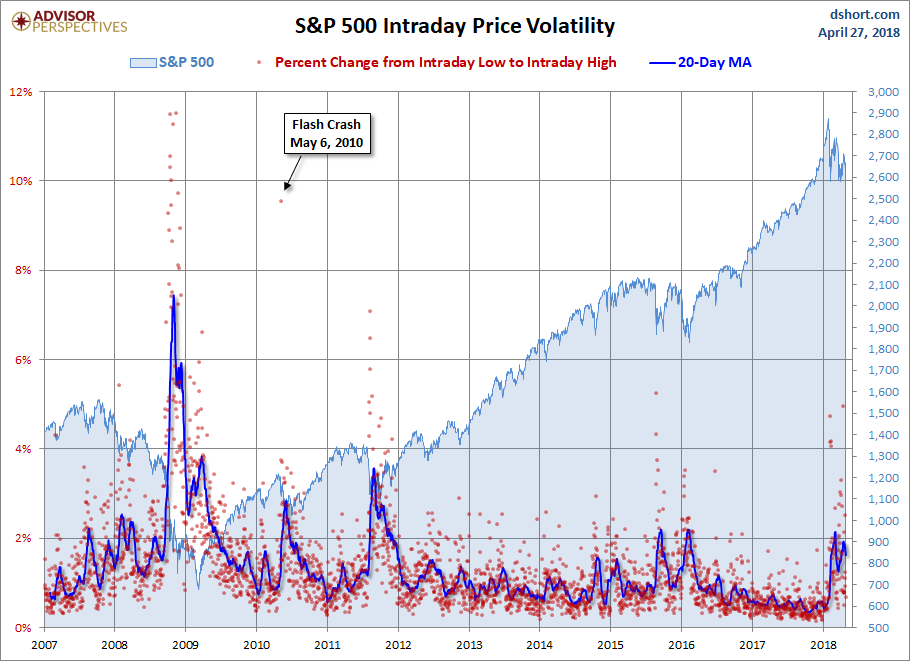
A Perspective on Volatility
For a sense of the correlation between the closing price and intraday volatility, the chart below overlays the S&P 500 since 2007 with the intraday price range. We’ve also included a 20-day moving average to help identify trends in volatility.


Leave A Comment