
Despite a the jump in jobless claims, the S&P 500 rallied to its 0.46% intraday high five minutes after the open and then sold off steadily to its -0.55% intraday low at the beginning of the lunch hour. An afternoon rally took the index back into the green, but selling in the final hour took the index a couple of ticks below the flat line to its -0.02% close. After yesterday’s -4.44% plunge in the retail ETF XRT( which lost another 0.26%), retail remained in focus today with Apple taking a -2.37% dive to its lowest level since June 2014. This comes in advance of tomorrow’s release of the Census Bureau’s report on April retail sales. And speaking of retail sales, as we’re posting this update, we see that Nordstrom shares are down 17% in after-hour trading after announcing week earnings and slowing sales (more here).
As for the old “sell in May” adage, after nine sessions, the index is remains near the flat line at -0.06% for the month.
The yield on the 10-year note closed at 1.75%, up two basis points from the previous close.
Here is a snapshot of past five sessions in the S&P 500.

Here is a daily chart of the index. Volume was again unremarkable.

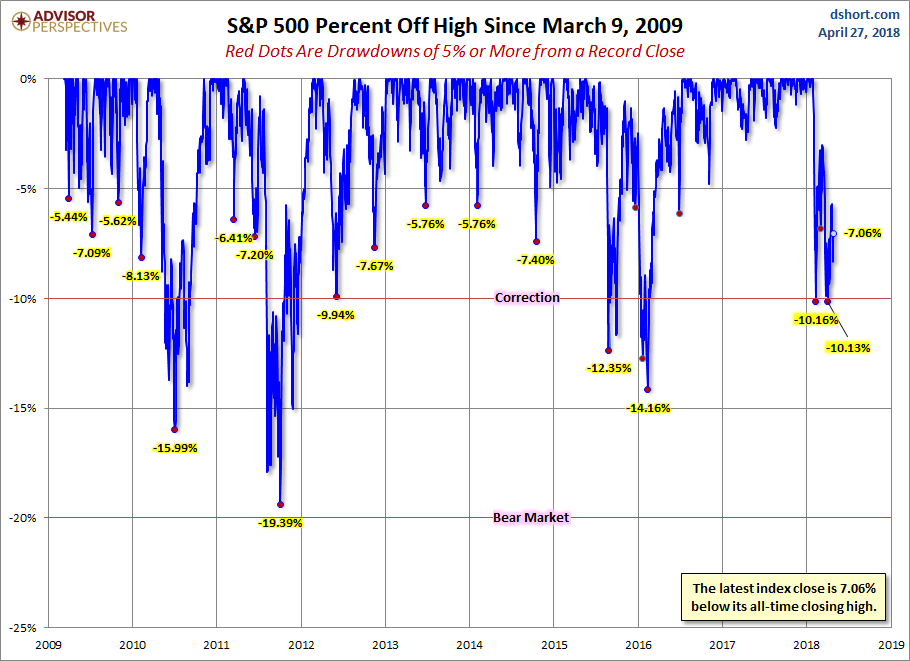
A Perspective on Drawdowns
Here’s a snapshot of selloffs since the 2009 trough.
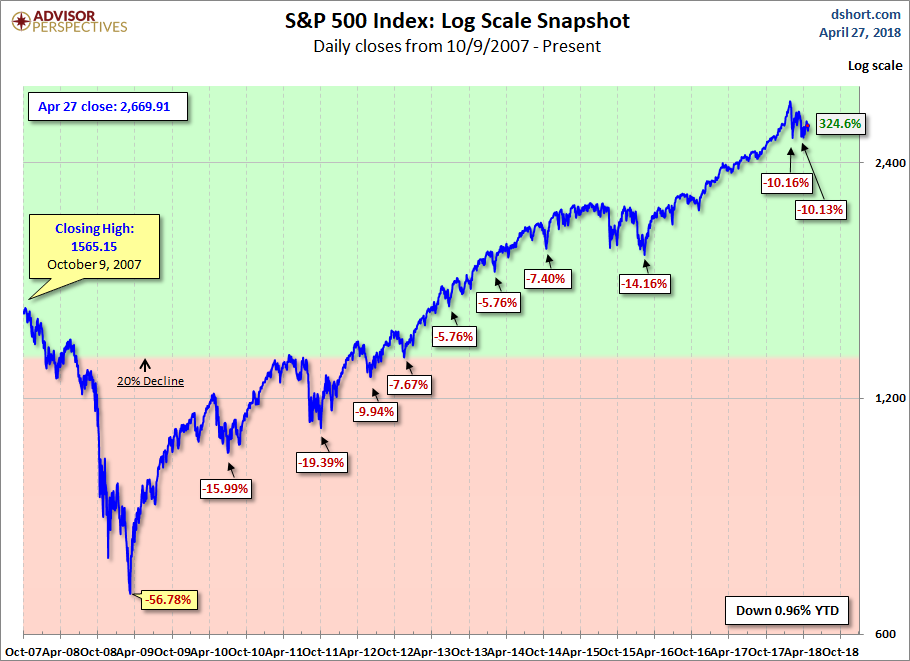
Here is a more conventional log-scale chart with drawdowns highlighted.
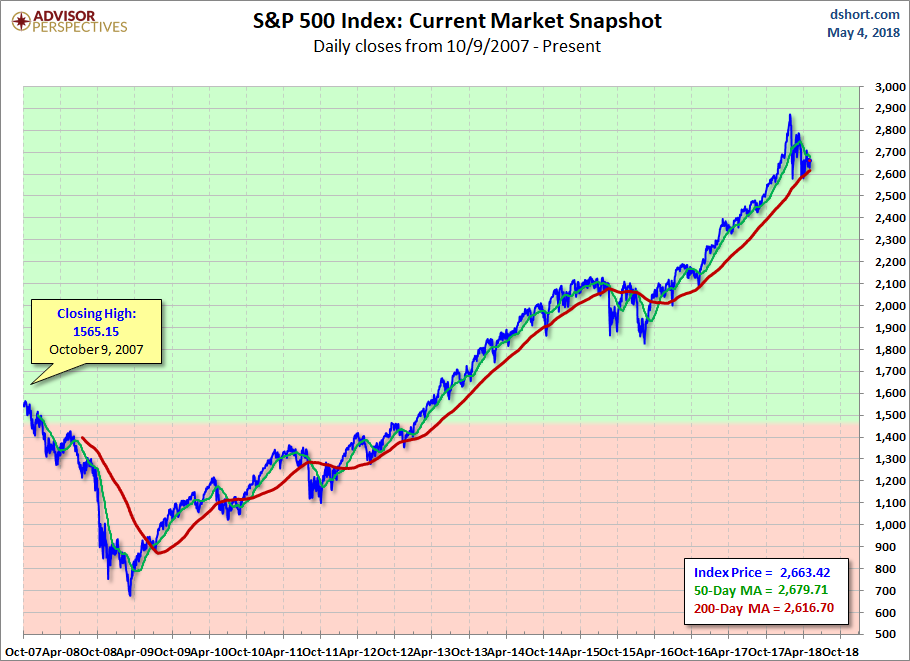
Here is a linear scale version of the same chart with the 50- and 200-day moving averages.
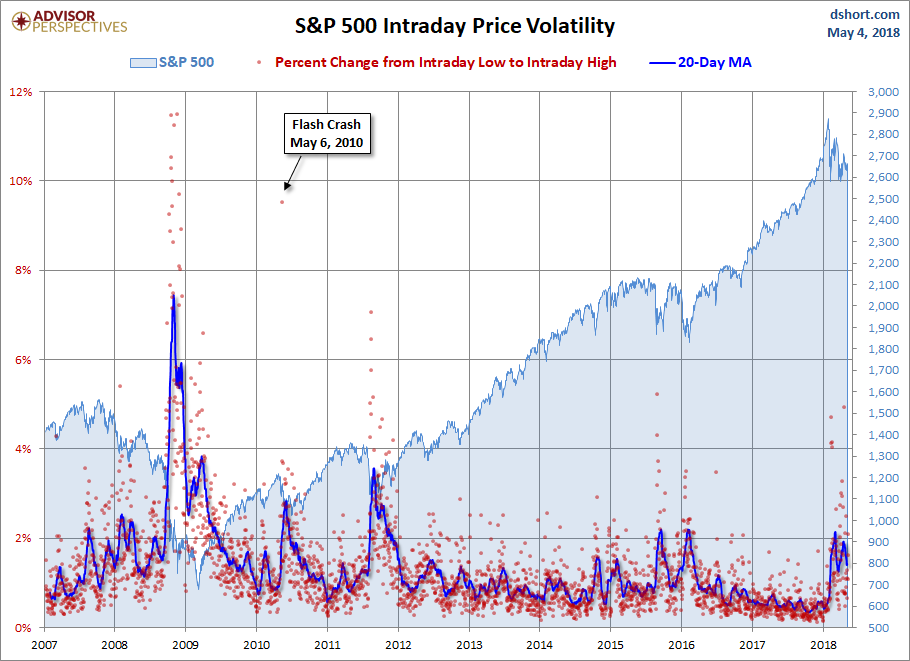
A Perspective on Volatility
For a sense of the correlation between the closing price and intraday volatility, the chart below overlays the S&P 500 since 2007 with the intraday price range. We’ve also included a 20-day moving average to help identify trends in volatility.


Leave A Comment