Our benchmark S&P 500 went nowhere today (-0.003% to three decimal places) in the second narrowest intraday range of 2016. The narrowest was the previous session. Interestingly enough, today’s 3% drop in WTI March crude futures didn’t have any impact equities. When we look back over the week, we also see that the Wednesday afternoon release of the FOMC minutes had uncharacteristically little effect on the market. The typical gaming of the minutes was replaced by zombie-like indifference. Are we seeing a lull before the storm? And if so, will it be a storm of buying or selling?
Treasuries also appeared to be in a trance. The yield on the 10-year note closed at 1.76%, up 1 basis point from the previous close.
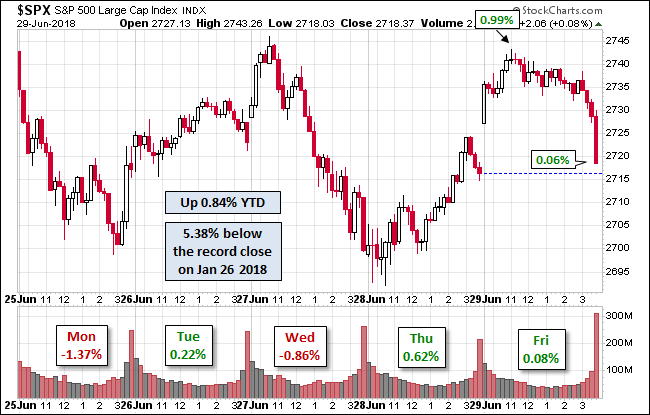
Here is a snapshot of past five sessions.

Here is a daily chart of the SPY ETF, which gives a better sense of investor participation (or lack thereof) over the past five sessions.

A Perspective on Drawdowns
Here’s a snapshot of selloffs since the 2009 trough.

A Perspective on Volatility
For a sense of the correlation between the closing price and intraday volatility, the chart below overlays the S&P 500 since 2007 with the intraday price range. We’ve also included a 20-day moving average to help identify trends in volatility.

Here is the same chart with the 50- and 200-day moving averages.


Leave A Comment