
Action in our benchmark S&P 500 was a close duplicate of yesterday. The index vacillated in the shallow red during the early trade and the drifted higher to close with a modest gain at or near its intraday high. Today glide from the morning low to the close was even smoother than yesterday. The S&P 500 has now trimmed its YTD loss to 2.47% and is now down only 6.45% from its record close last May.
The yield on the 10-year note closed at 1.83%, down one basis point from the previous close.
Here is a snapshot of past five sessions in the S&P 500.

Here is a daily chart of the SPY ETF, which give a better sense of investor participation than the underlying index. Trading volume has faded over the past two sessions. Are we seeing a lack of conviction? Or caution ahead of the Friday jobs report?

A Perspective on Drawdowns
Here’s a snapshot of selloffs since the 2009 trough.

Here is a more conventional log-scale chart with drawdowns highlighted.

Here is a linear scale version of the same chart with the 50- and 200-day moving averages.

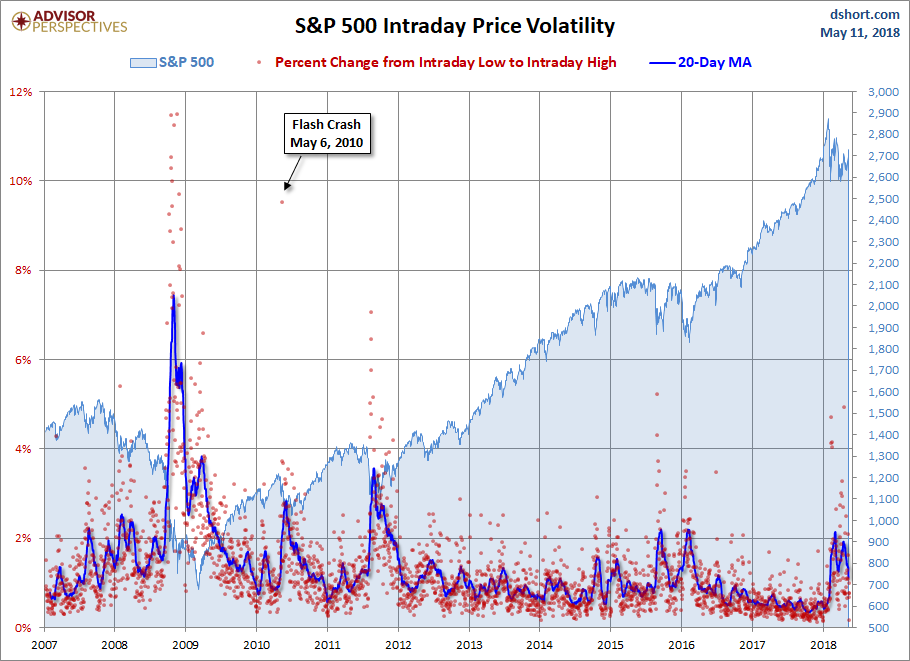
A Perspective on Volatility
For a sense of the correlation between the closing price and intraday volatility, the chart below overlays the S&P 500 since 2007 with the intraday price range. We’ve also included a 20-day moving average to help identify trends in volatility.


Leave A Comment