
Our benchmark S&P 500 soared at the open, gave back about half its gain by mid-morning and then rose through the lunch hour to a narrow trading range through the rest of the afternoon. The index closed with gain of 1.65%, a tick off its intraday high in the closing seconds. Today’s advance was day two of a rally following a five-day selloff that ended last Thursday at an interim low off the record high in May of last year.
The yield on the 10-year note closed at 1.78%, up 4 basis points from the previous close.
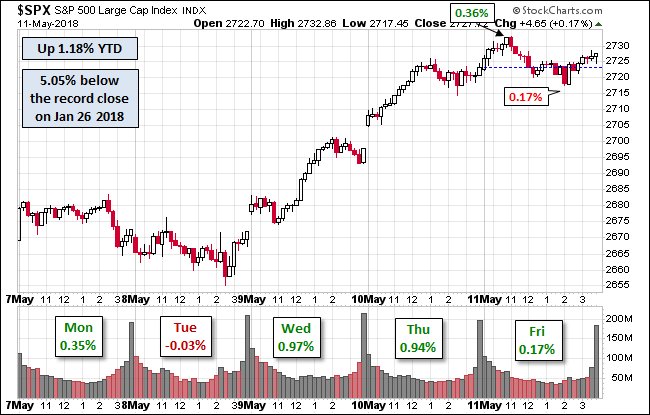
Here is a snapshot of past five sessions.
Here is a daily chart of the SPY ETF, which gives a better sense of investor participation in in the two-day rally. As we readily see, trading volume doesn’t suggest much conviction in the recovery.

A Perspective on Drawdowns
Here’s a snapshot of selloffs since the 2009 trough.

A Perspective on Volatility
For a sense of the correlation between the closing price and intraday volatility, the chart below overlays the S&P 500 since 2007 with the intraday price range. We’ve also included a 20-day moving average to help identify trends in volatility.

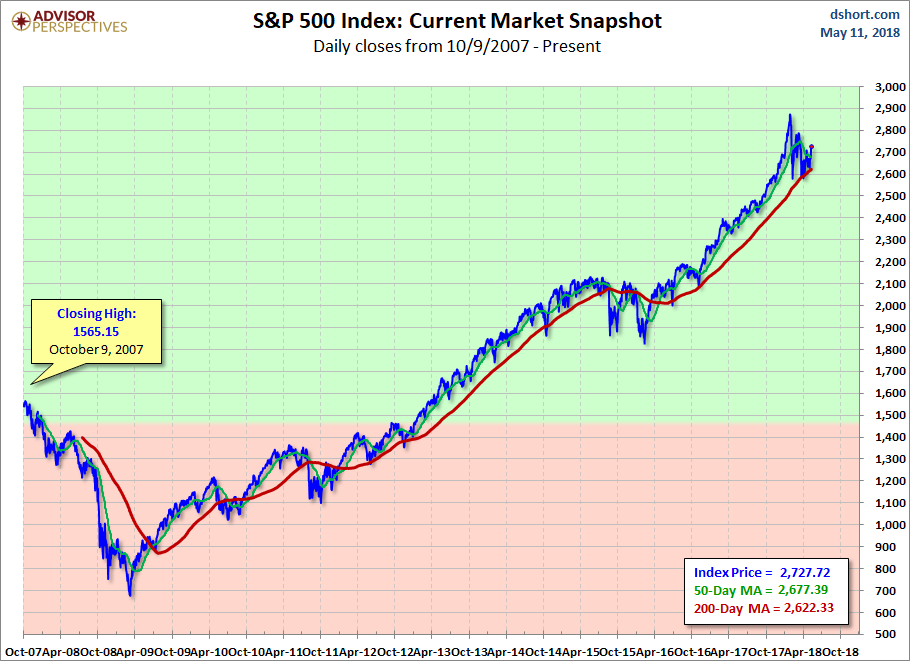
Here is the same chart with the 50- and 200-day moving averages.


Leave A Comment