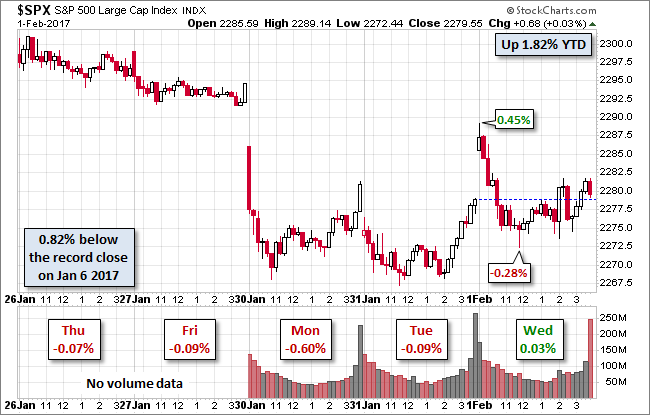
The strong January ADP employment data before the market opened goosed the already positive futures and helped trigger a the 0.45% intraday high about five minutes into the session. The index then sold off to its -0.28% intraday low just before the lunch hour. It then traded in a fairly narrow range to the 2 PM release of the Fed minutes, which triggered a fast-trade head fake. The 500 closed the session with a minuscule 0.3% gain.

The U.S. Treasury puts the closing yield on the 10-year note at 2.48%, up three BPs from the previous close.
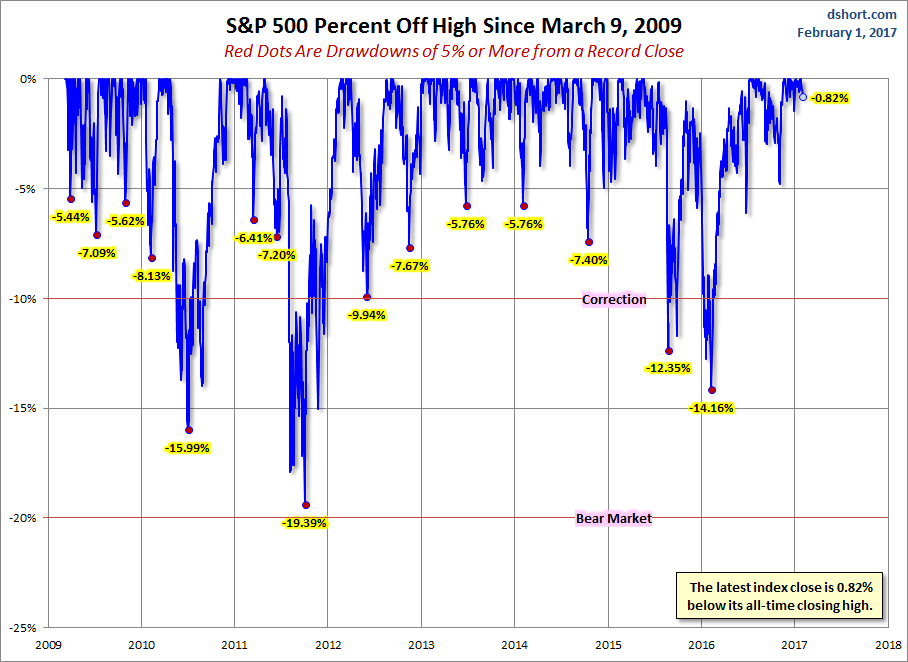
A Perspective on Drawdowns
Here’s a snapshot of record highs and selloffs since the 2009 trough.
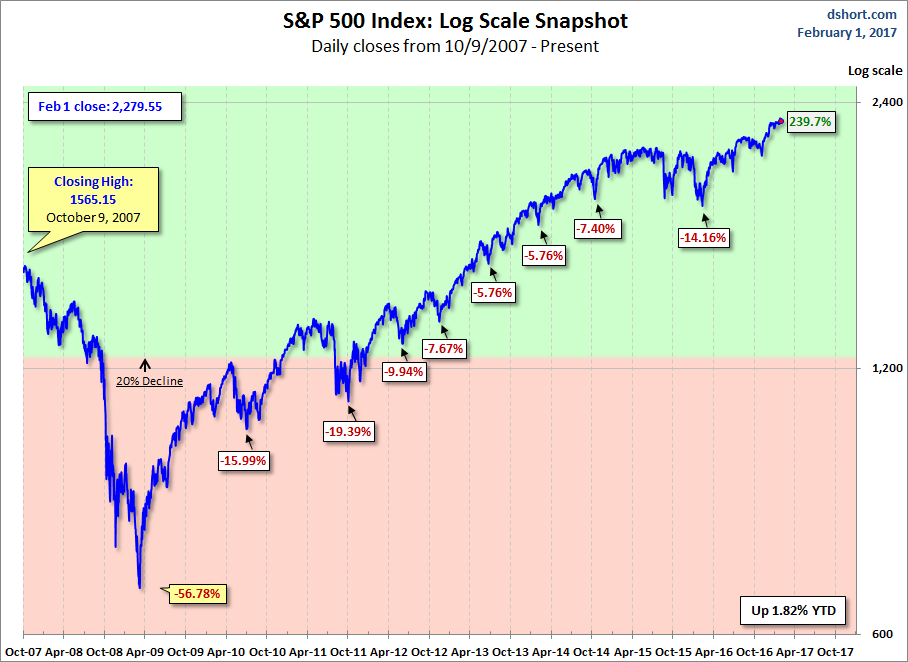
Here is a more conventional log-scale chart with drawdowns highlighted.
Here is a linear scale version of the same chart with the 50- and 200-day moving averages.

A Perspective on Volatility
For a sense of the correlation between the closing price and intraday volatility, the chart below overlays the S&P 500 since 2007 with the intraday price range. We’ve also included a 20-day moving average to help identify trends in volatility.


Leave A Comment