Before the US market opened, while global equities were in rally mode, an avalanche of economic data surprised to the upside. Instead of the expected downward revision to Q4 GDP, it was revised upward. The BEA’s Personal Consumption and Outlays report, which usually comes out a day after GDP, also came in uniformly stronger than expect. Consumer Sentiment rose. And the Fed’s favorite inflation index, YoY Core PCE, moved closer to the Fed’s 2% target and is now at its highest level in nearly three years.
How did our benchmark S&P 500 react to strong economic data? Catatonia. It posted a fractional -0.19% loss on the third smallest intraday trading range of 2016. Perhaps the more accurate diagnosis is Obsessive-Compulsive Disorder … namely its obsession with the price of oil. West Texas Crude ended the day down 0.91%. Or maybe we’re seeing the Fed Fear Factor: Strong economic data, including a rise in inflation, that increases the odds of a March rate hike.
The yield on the 10-year note closed at 1.76%, up six basis points from the previous close.
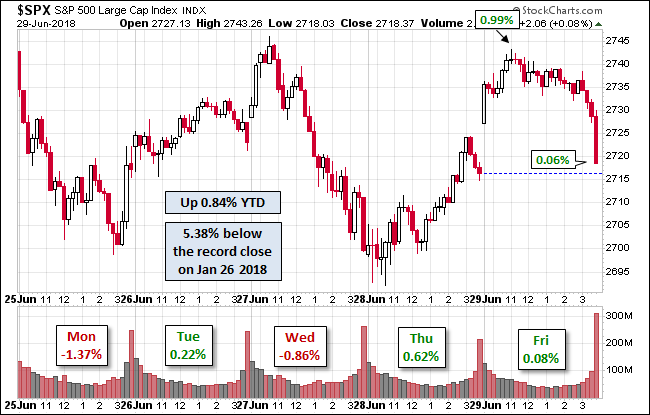
Here is a snapshot of past five sessions in the S&P 500.

Here is a weekly chart of the index. The index has been in rally mode for the past two weeks and is now above its 10-week price moving average. But compared to the prior sellof, diminished volume suggests a lack of conviction.

A Perspective on Drawdowns
Here’s a snapshot of selloffs since the 2009 trough.

Here is a more conventional log-scale chart with drawdowns highlighted.

Here is a linear scale version of the same chart with the 50- and 200-day moving averages.

A Perspective on Volatility
For a sense of the correlation between the closing price and intraday volatility, the chart below overlays the S&P 500 since 2007 with the intraday price range. We’ve also included a 20-day moving average to help identify trends in volatility.


Leave A Comment