
The three-day rally in our benchmark S&P 500 ended today with a -0.47% close, but fractionally off its -0.61% intraday low seconds before the final bell. The loss was just enough to put the index back in correction mode, down exactly 10.00% from its record close last May. An interesting feature of today action was the relative inaction. The 0.78% intraday range was the lowest so far this year, and volume was light.
The yield on the 10-year note closed at 1.75%, down 6 basis points from the previous close.
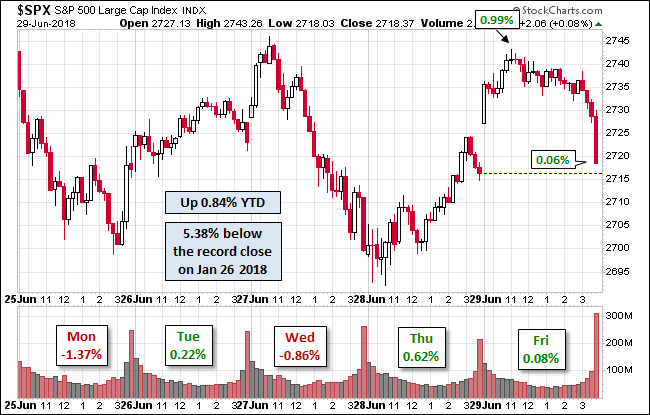
Here is a snapshot of past five sessions.
Here is a daily chart of the SPY ETF, which gives a better sense of investor participation (or lack thereof) in today’s trade.

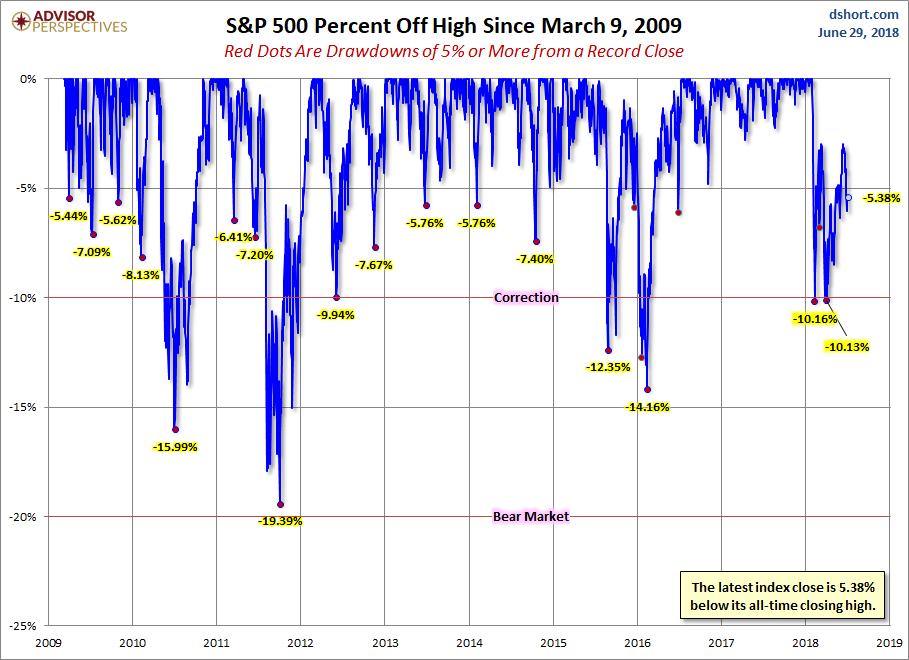
A Perspective on Drawdowns
Here’s a snapshot of selloffs since the 2009 trough.
A Perspective on Volatility
For a sense of the correlation between the closing price and intraday volatility, the chart below overlays the S&P 500 since 2007 with the intraday price range. We’ve also included a 20-day moving average to help identify trends in volatility.

Here is the same chart with the 50- and 200-day moving averages.


Leave A Comment