This morning we are seeing some follow through to Friday’s amazing reversal. However there is still some technical damage that was done during August’s sell off and it may take some time to work itself out.
Click on picture to enlarge

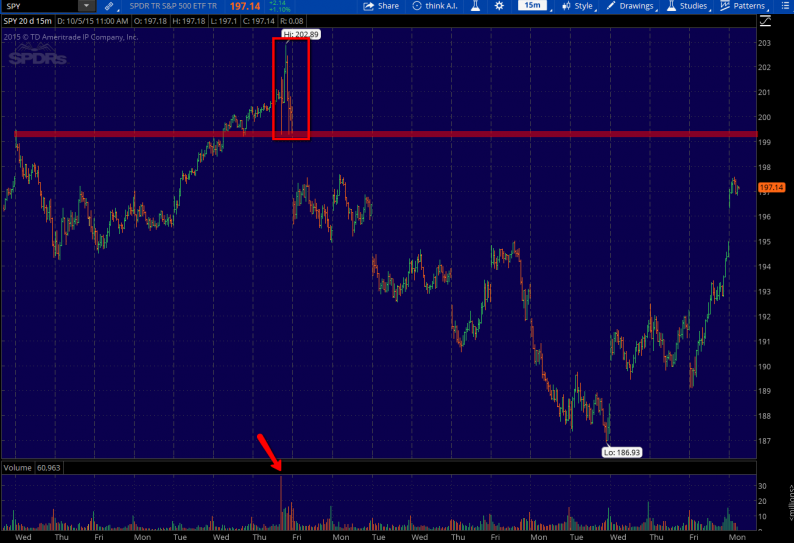
The next closest resistance level is between 1986-1990, these are the levels left behind during the volatile September FOMC statement. I’ve attached a chart of the SPY (S+P 500 etf) to highlight the volume and the price action during that session.
This is the likely target now that buyers (short covering) have stepped in to defend the August lows. Overall I am anticipating a breakout to the upside. But I do believe there will be some type of reaction if/when we get to resistance, as there is a lot of supply overhead.
Click on picture to enlarge
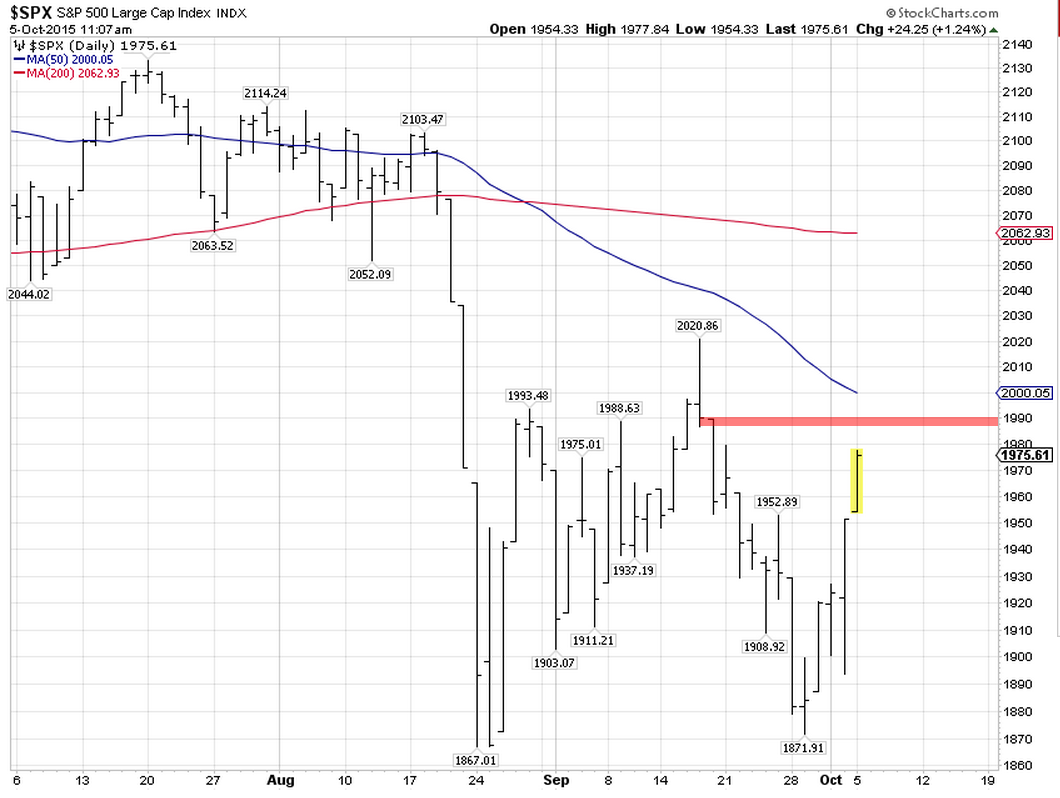
The S+P 500 cash index equivalent is in the 1986-1990 area. This should coincide with the downsloping 50 day moving average in a few days as well.
Once resistance is reached I’ll highlight potential support levels below.


Leave A Comment