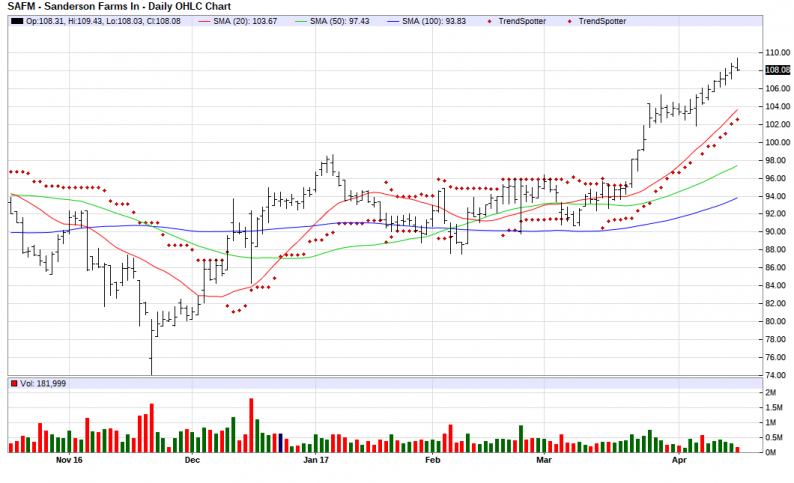
The Chart of the Day belongs to Sanderson Farms (SAFM). I found the poultry products stock by using Barchart to sort today’s All Time High list first for the most frequent number of new highs in the last month, then again for technical buy signals of 80% or more. Since the Trend Spotter signaled a buy on 3/22 the stock gained 10.20%.
Sanderson Farms Inc. is a fully-integrated poultry processing company engaged in the production, processing, marketing and distribution of fresh and frozen chicken products. The company sells ice pack, chill pack and frozen chicken, in whole, cut-up and boneless form, primarily under the Sanderson Farms7 brand name to retailers, distributors, and fast food operators principally in the southeastern, southwestern and western United States.

Barchart technical indicators:
Fundamental factors:


Leave A Comment