
I had to think a bit before going with that title. The term “melt-up” is an increasingly overused word, and given this article features what I think are some really interesting charts it would be a shame to drive readers away with the cliché. But what else do you call it?
The point of this article is to discuss a couple of charts I recently shared on Twitter, as well as a couple of charts that haven’t yet seen the light of day, and a chart from the latest weekly survey of Finance Twitter (which asks about equity and bond positioning/views based on technicals vs fundamentals).
The main takeaways are:
-Investors have clearly undertaken a major reassessment of the “fundamentals”.
-Whether it’s surveyed sentiment, analyst expectations, or punters on Twitter, optimism has become the dominant mood of the market.
-A couple of seldom talked about measures of stock market leverage show that investors seem to be putting their money where their mouth is, as money flows into leveraged bets.
-It’s tempting to become “fearful as others are greedy”, but the challenge is that these are the conditions that can set off a virtuous cycle the likes of which have the power to steamroll contrarian bears.
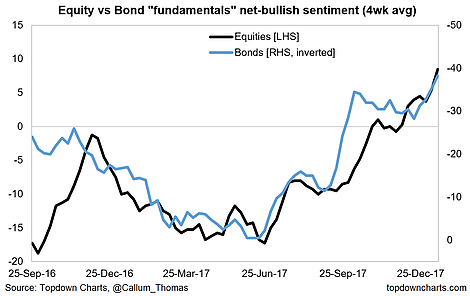
1. Bullish Fundamentals: First up is a look at the survey I mentioned. This chart is one of my favorites from that data series – it shows the (smoothed) net-bullish responses for the “fundamentals” side of the survey (again, the survey asks whether respondents are bullish or bearish for fundamental vs technical rationale). This chart shows you there has been a massive reassessment of the fundamentals since the middle of last year. And if you look at the survey response details it’s consistent across equities and bonds and is consistent across both the bullish and bearish responses on the fundamentals side.
2. Bullish Analysts: This chart provides a good follow-on and is really quite astounding. It shows the Earnings Revisions Ratio for the S&P500 [based on the Thomson Reuters I/B/E/S data, and calculated as = (revisions up – revisions down)/(revisions up + revisions down)]. The punchline is it’s at an all-time high. That is, the overwhelmingly dominant earnings forecast change has been to the upside. This continues the general upwards trend in this indicator seen since 2015/16, but of course, the latest spike has much to do with the tax cuts – which likely proffer as much of a sentiment boost as an actual economic boost. Hopefully, it’s not a case of one hand giveth (the tax cuts) and the other hand taketh (a potential government shutdown as early as Friday)!


Leave A Comment