
Econintersect’s Economic Index continues to remain in a tight range indicating static economic growth fundamentals for the fifth month in a row. However, this tight range remains in territory associated with normal growth. Six-month employment growth forecast is now indicating little change in the rate of employment growth.

Please share this article – Go to very top of page, right hand side for social media buttons.
Analyst Summary of this Economic Forecast
The growth projections over the last five months have stayed in a tight range. However, the surprise this month was the significant backward revision in disposable personal income by the BEA which has caused detrimentally high spending to income ratios (discussed below). As personal income and personal spending is not part of our economic index – it does explain the recent static conditions in the economic growth forecast..
Our 6-month employment forecast is for little change in the rate of employment growth.
This index is not designed to guess GDP – or the four horsemen used by the NBER to identify recessions (industrial production, business sales, employment and personal income). It is designed to look at the economy at the Main Street level.
The graph below plots GDP (which has a bias to the average – not median – sectors) against the Econintersect Economic Index.

This post will summarize the:
Special Indicators:
The consumer is still consuming. The ratio of spending to income has been very elevated since September 2016. There have been only three extended periods in history where the ratio of spending to income has exceeded 0.92 (the months surrounding the 2001 recession, from September 2004 to the beginning of the 2007 Great Recession, and since September 2016).
Seasonally Adjusted Spending’s Ratio to Income (an increasing ratio means Consumer is spending more of Income)

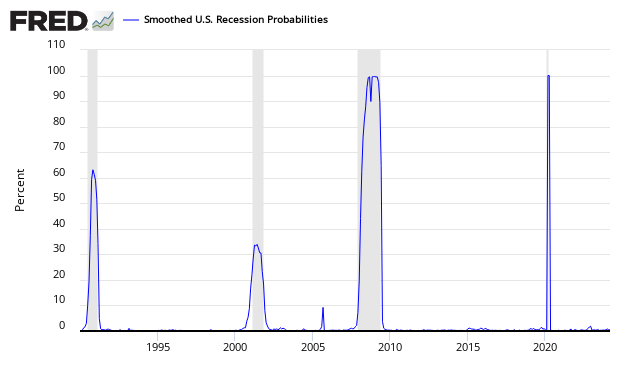
The St. Louis Fed produces a Smoothed U.S. Recession Probabilities Chart which is currently giving no indication of an oncoming recession.
Smoothed recession probabilities for the United States are obtained from a dynamic-factor markov-switching model applied to four monthly coincident variables: non-farm payroll employment, the index of industrial production, real personal income excluding transfer payments, and real manufacturing and trade sales. This model was originally developed in Chauvet, M., “An Economic Characterization of Business Cycle Dynamics with Factor Structure and Regime Switching,” International Economic Review, 1998, 39, 969-996. (http://faculty.ucr.edu/~chauvet/ier.pdf)
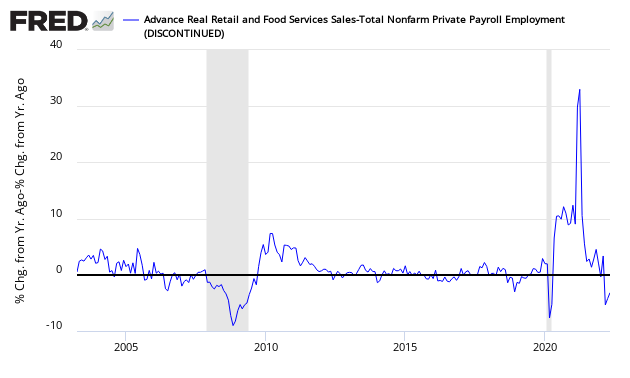
Econintersect reviews the relationship between the year-over-year growth rate of non-farm private employment and the year-over-year real growth rate of retail sales. This index is now barely positive. When retail sales grow faster than the rate of employment gains (above zero on the below graph) – a recession is not imminent. However, this index has many false alarms.
Growth Relationship Between Retail Sales and Non-Farm Private Employment – Above zero suggests economic expansion
The growth rate of real gross domestic product (GDP) is the headline view of economic activity, but the official estimate is released with a delay. Atlanta’s Fed GDPNow forecasting model provides a “nowcast” of the official estimate prior to its release. Econintersect does not believe GDP is a good tool to view what is happening at Main Street level – but there are correlations.

z forecast8.png or source


Leave A Comment