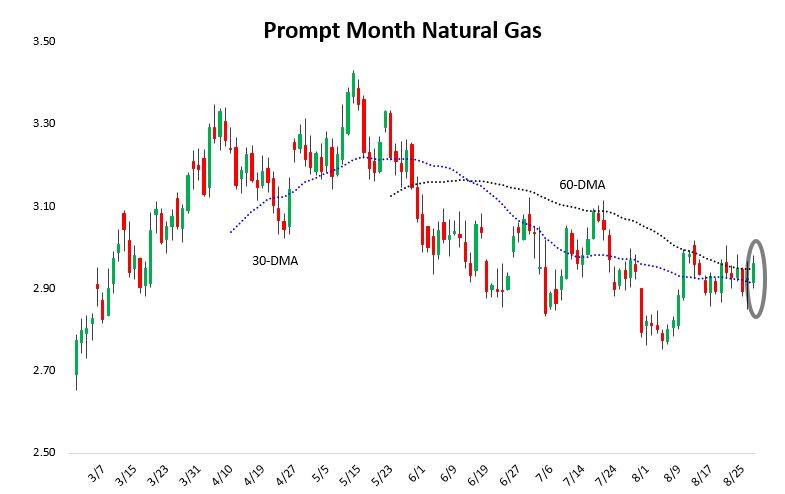
The September natural gas contract went off the board today in the midst of Tropical Storm Harvey still churning in the Gulf of Mexico, and the result was a bit of excitement. The expiry led to the first prompt month close above the prompt month 60-Day Moving Average (DMA) since late May, though much of this was driven by the spike in prices near the end of the day.

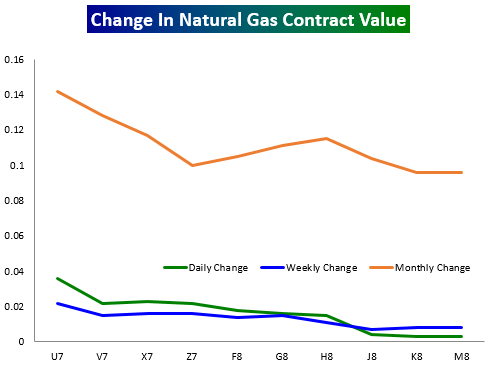
Into the end of the trading day it became clear that it was the September expiry that was driving prices as well, as we saw decent prompt month isolation.
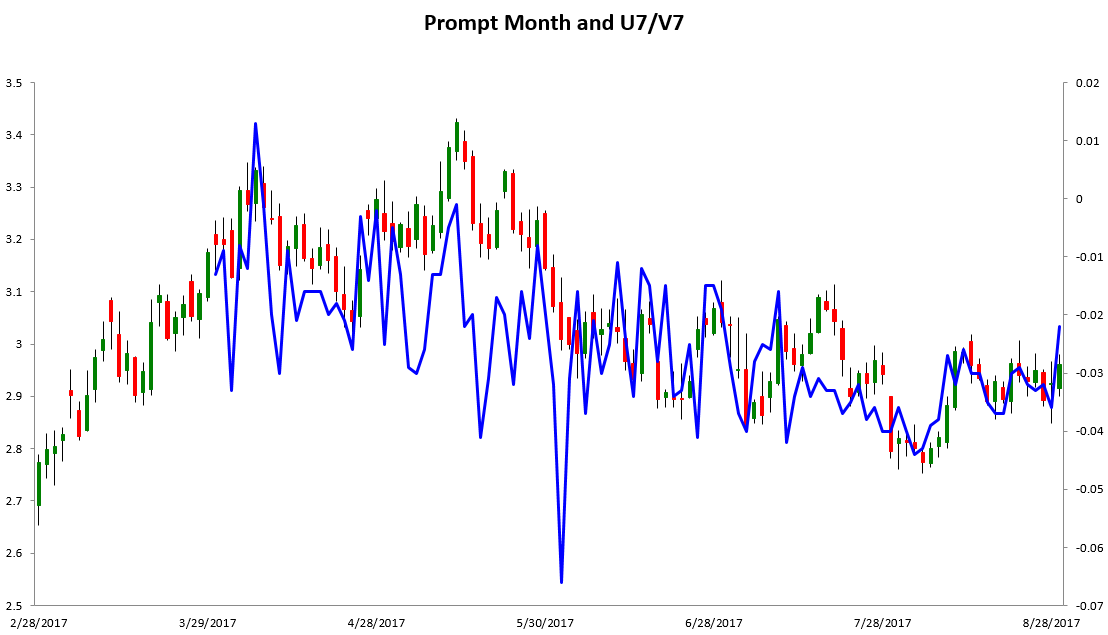
The amount of prompt month isolation can best be seen here, with U7/V7 rising to the highest level since mid-July on the U7 rally.
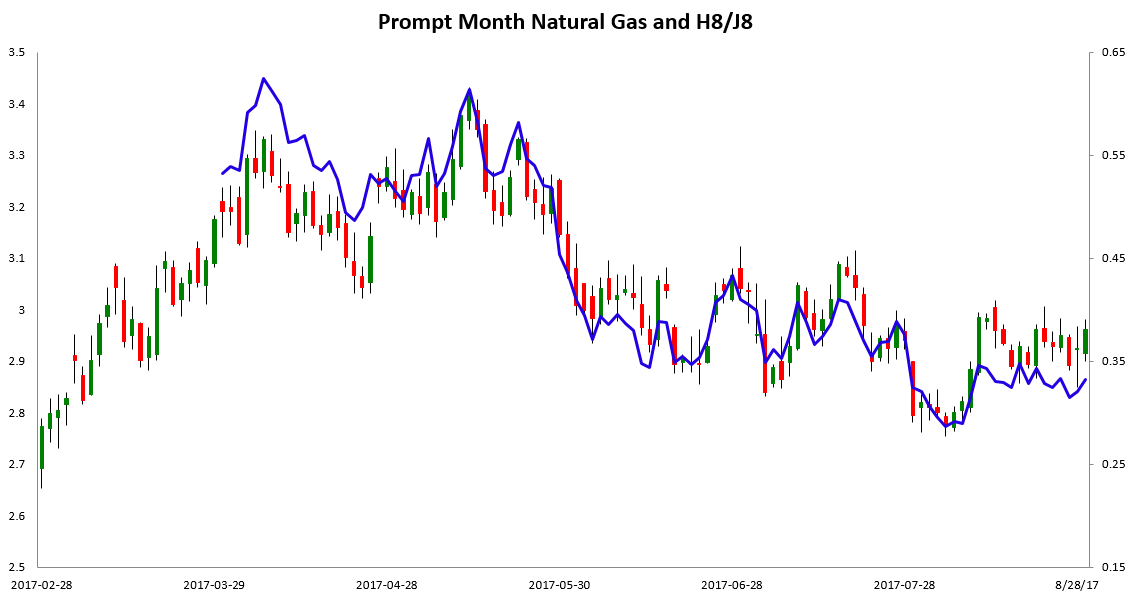
Yet elsewhere the natural gas strip did not appear especially excited about this bounce late in the day. We note that the H/J spread widened only slightly on the day and is still a bit below levels from a week ago despite prompt month prices going out near the same level.
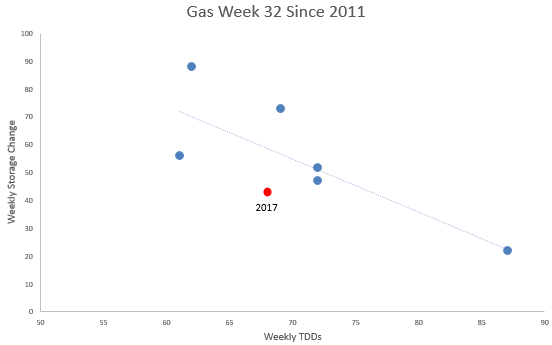
For this reason, we would caution against reading too much into the September expiry moving forward. The natural gas market is structurally quite tight, as seen by last week’s EIA print, and the print to be announced on Thursday is expected to be quite tight too.
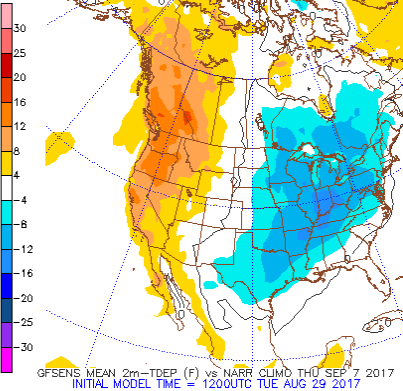
This tightness has helped stabilize cash prices and the front of the natural gas strip recently, and likely played a role in the September contract rallying into its expiry. But this remains tempered by bearish forward weather expectations as well, as seen by the very cold Day 9 American GEFS model forecast below (courtesy of the Pennsylvania State Electronic Wall map site).
Additionally, we are tracking Invest 93L across the Atlantic that looks to gradually move towards the country over the next week and a half. Though it is far too early to predict intensity or exact track, it is clear that it does pose a bit of a risk to the United States, and for the natural gas market the risks posed would likely be bearish as it holds the potential to knock out power and kill more cooling loads. Shown below is the latest National Hurricane Center outlook for where it may form and a spaghetti plot showing potential future tracks for the system.


Leave A Comment