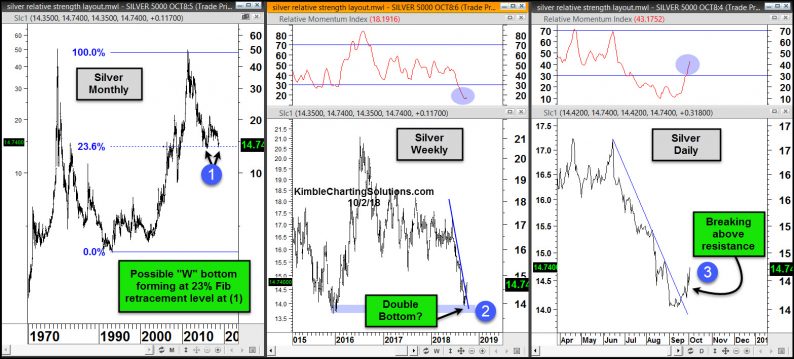

Is Silver creating a double bottom and breaking above key resistance levels? Could be.
This 3-pack looks at Silver at three different time frames. The left chart looks at Silver on a “Monthly” basis since late 1970’s. The middle chart looks at Silver on a “Weekly basis” over the past three years and the right chart looks at Silver on a “Daily basis” for the past 6-months.
The monthly chart highlights that the decline from the 2011 highs is testing the 23% Fibonacci retracement level based upon the 1993 lows and 2011 highs. Silver could be creating a double bottom while testing the 23% level at (1).
The weekly chart reflects that Silver is testing the 2015/2016 lows at (2), as momentum is the most oversold in years.
Silver is attempting to break above steep falling resistance on a daily basis at (3), as oversold momentum is attempting to turn higher.
No doubt the long-term trend in Silver remains down. The Power of the pattern is keeping a close eye on this hard hit asset, as it could be attempting to create a tradable opportunity due to these patterns.


Leave A Comment