
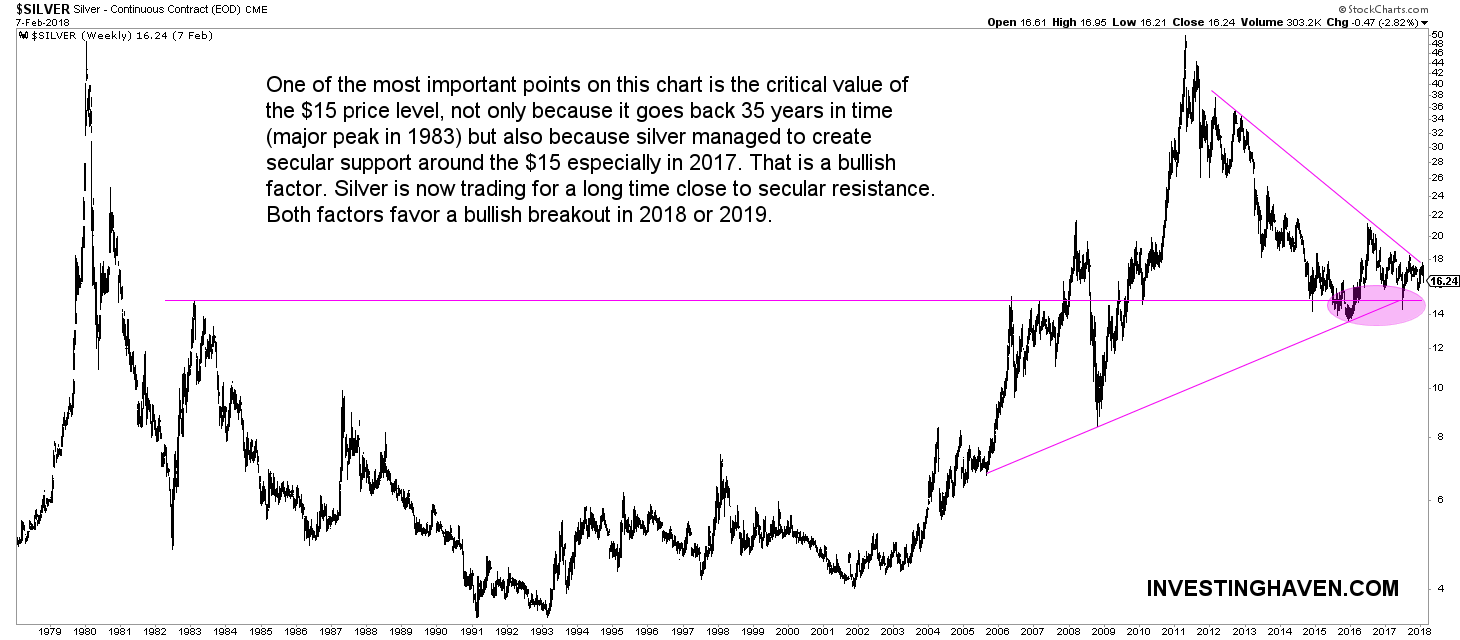
In our latest silver market update we wrote that we see a bullish and a bearish side: Silver has a bearish and a bullish chart. Interestingly the 5-year weekly chart of silver shows a neutral to slightly bearish trend. However, the 40-year silver chart has a much more bullish looking.
Essentially it is key for investors to monitor closely markets are close to a secular breakout or breakdown. Silver, in particular, is moving in a narrowing area between $15 and $18 which is just a 20 percent range. Sooner rather than later silver’s resistance or support has to break which will result in a continuation of the 7-year bear market or the start of a new bull market.
We do not see any change in the silver trend. So far there is a neutral to slightly bearish trend but the long term chart shows that a breakout is still very close (only 10 percent). The recent drop in the price of silver did not change anything in the silver market regardless of what some pretend to say.
In our Silver Price Forecast For 2018 written almost 3 months ago we concluded the following:
Are we able to forecast a precise silver price target for 2018? We have a hard time doing so, and we promise readers to continuously follow up, and update this article each time we get a new signal on silver’s chart or in the silver market which could lead to a price target.
For now, though, we stick to a neutral trend forecast in silver, with a bearish bias.
The annotations on the long term silver chart say it all. We continue to watch the $15 to $18 area very closely, and, next, the $21 level as the next important breakout point.


Leave A Comment