
After a strong bull run from 2009 to 2017 it’s prudent to consider these two questions…
#1. What if the market stalls out, and becomes range bound for 20 years?
It’s happened before. Below you’ll find a monthly chart of such a period.
#2. How can you stay with the current trend, without getting caught long at the inevitable market top? Nothing goes up forever.
Range Bound Markets Happen After Big Bull Markets But They Don’t Have To End Trend Trades
From 1963 to 1982 the Dow was range bound between 650 and 1000. This could be viewed as a nightmare for trend followers. However, even range bound markets can provide great swing trading opportunities.
During this “difficult” period, January consistently provided great insight into the market’s trend.
More importantly, January gives the savvy trader multiple opportunities to start each year. And the opportunities don’t end in January.
If you’re not watching the January range with the simple rules I share below you’re missing out.
5 Out 5 Tops Identified
In the monthly chart of Dow Jones Index below you’ll see that the market topped out five times.
In all five cases, if you got defensive when the highest red line was broken, you would have avoided getting caught in the down trends.
Read below the chart for more details.
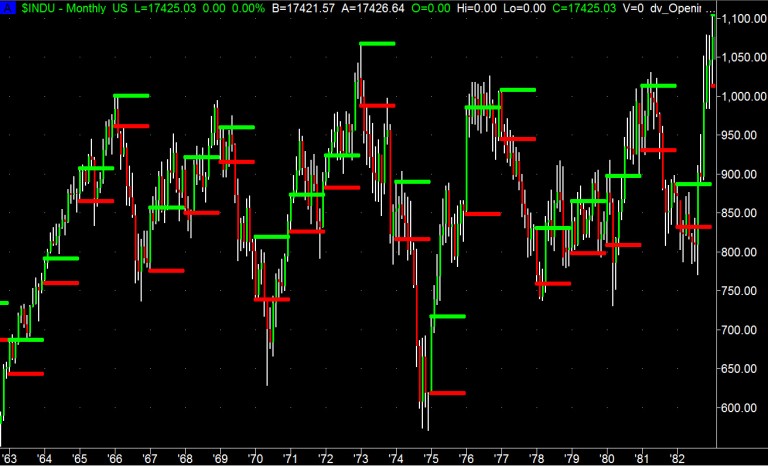
There Are Several Ways To Profit Using January’s Range
The green lines on the chart below represent the high of the month of January, and the red lines are the low of the month.
Look at these lines as key inflection points. An inflection point is a level from which the market’s trend will reverse if it stops. Or, if the inflection point is broken, the trend will have another significant move.
You’ll see that you could have found big trend trading opportunities in back to back monthly moves.
If you’d traded with a simple bullish bias when the market was above the January high, you would not have missed the uptrends.


Leave A Comment