
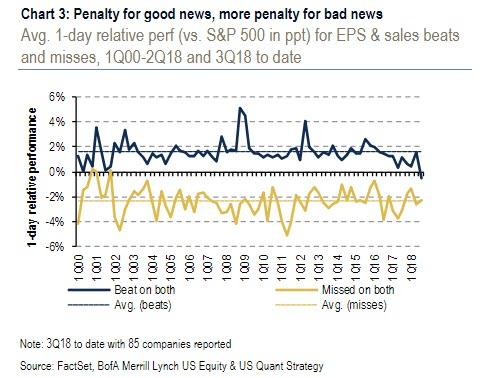
One week ago, with roughly half of earnings season in the books, FactSet and Bank of America revealed an ominous statistic about the jumpiness (or perhaps “peak earnings”) of the market: in a curious twist, companies that had reported positive earnings surprises for Q3 2018 were punished by the market, with their stock price decreasing by -0.5% two days before the earnings release through two days after the earnings. Meanwhile, and as one would expect, companies that reported negative earnings surprises for Q3 2018 have an average price decrease of -3.5% two days before the earnings release through two days after the earnings.
While the market penalizing companies for earnings misses is hardly a surprise, the lack of reward for EPS & sales beats is typically a later-stage bull market signal according to BofA strategist Savita Subramanian who wrote that “this suggests that the good news is priced in.” Putting these market reactions in context, the only time when the market had a sub-1% relative surprise reaction for beats was in both 1Q00 and 4Q07.
Now, Goldman’s derivatives strategist Katherine Fogerty points out another curious statistic about the bifurcation between single name and index vol: in the latest indication of just how nervous traders are about corporate earnings, with just over half of the S&P having reported results as of last Friday, the average stock moved +/-4.5%, marking the highest earnings move since the Financial Crisis (Q3 2009).

Of note, this is not due to overall market volatility because while the S&P500 was down just 2% during October 2009 (vs -7% October 2018), the average level of the VIX was 61%, substantially higher than 19% this month.
When broken out by sector, communications (comprised of Internet, Media, and Telecom stocks) exhibited the least ties to macro volatility on earnings and the largest absolute moves: the average stock in this sector realized a +/-7.0% move on earnings this quarter. After adjusting for sector performance, Goldman calculates a Residual Earnings Move of +/-6.3%. This is 2.1% higher than the average move these stocks have realized on prior earnings reports (2006 – present).


Leave A Comment