
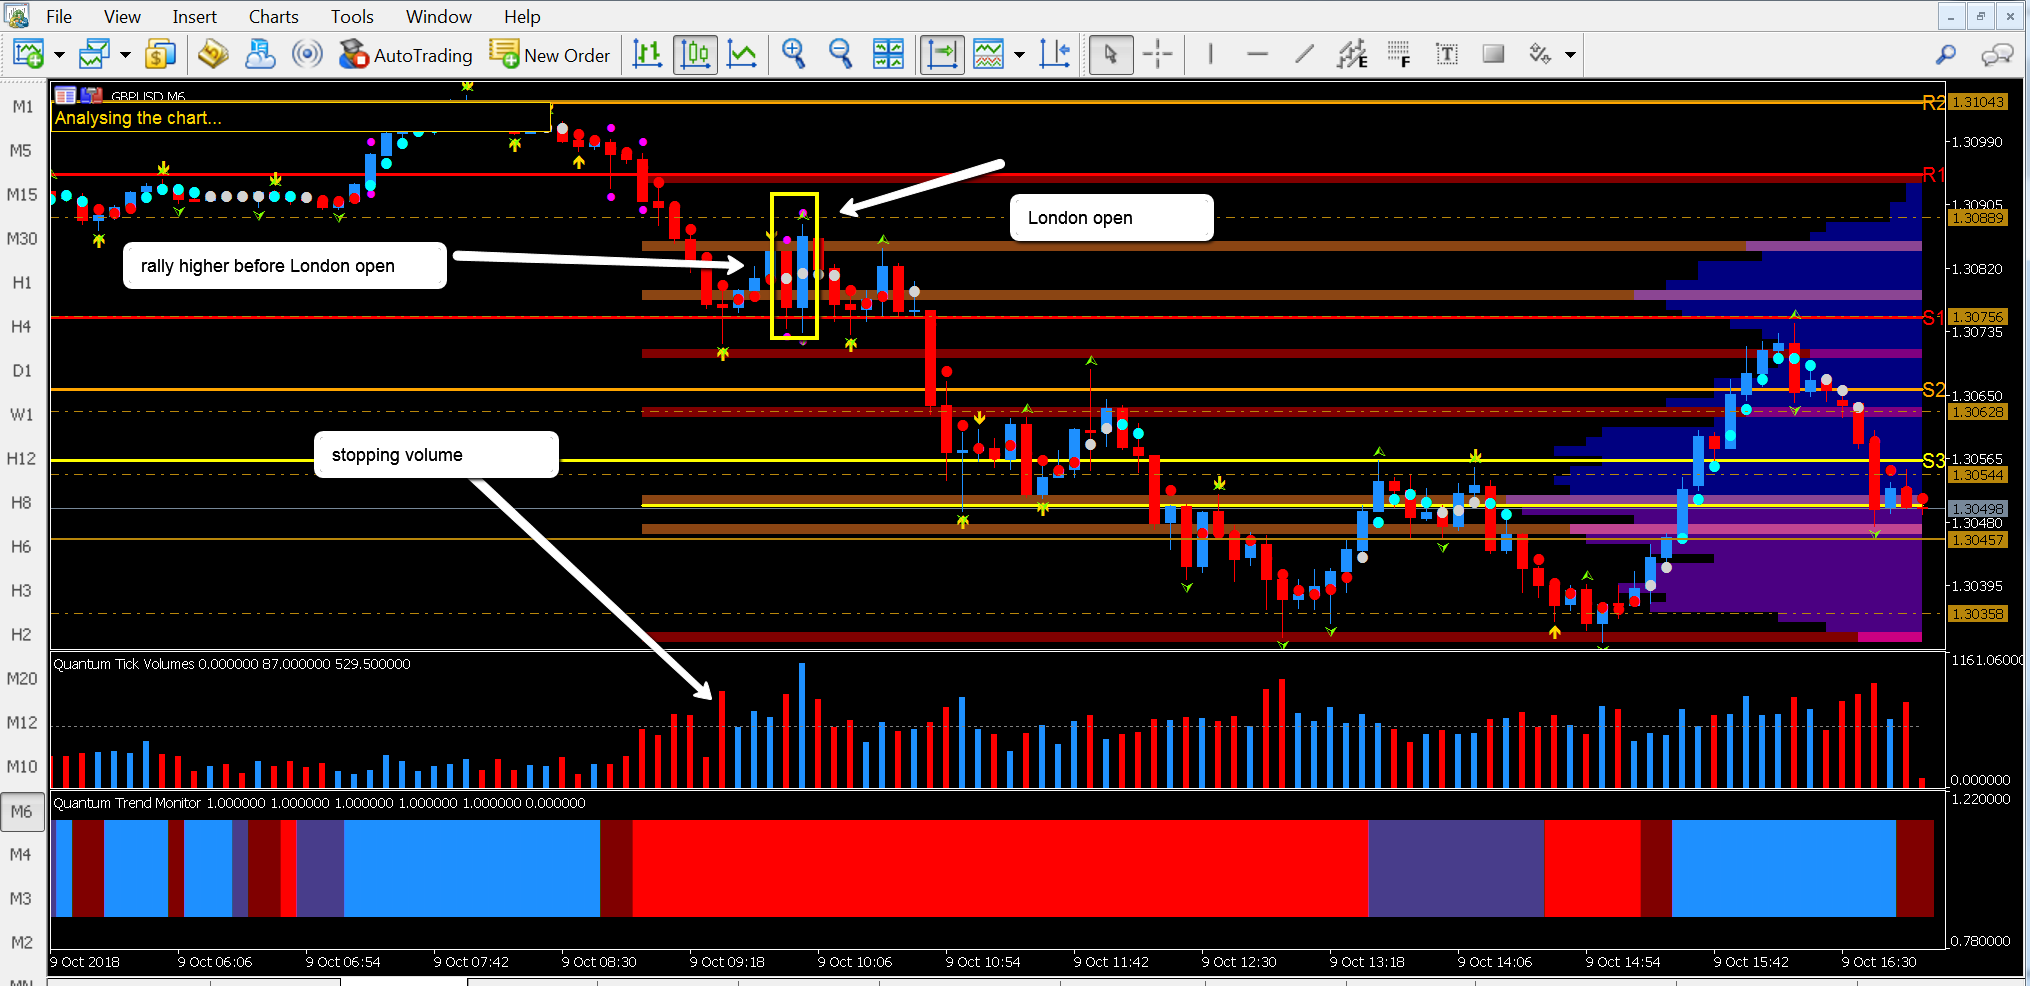
Just want to follow up on cable, look at the pair in three time frames, namely the 3, 6 and 12 min charts. I’ve selected these time frames from the MT5 platform as they offer us some great vpa lessons and in doubling the time frames also makes candle analysis a little easier.
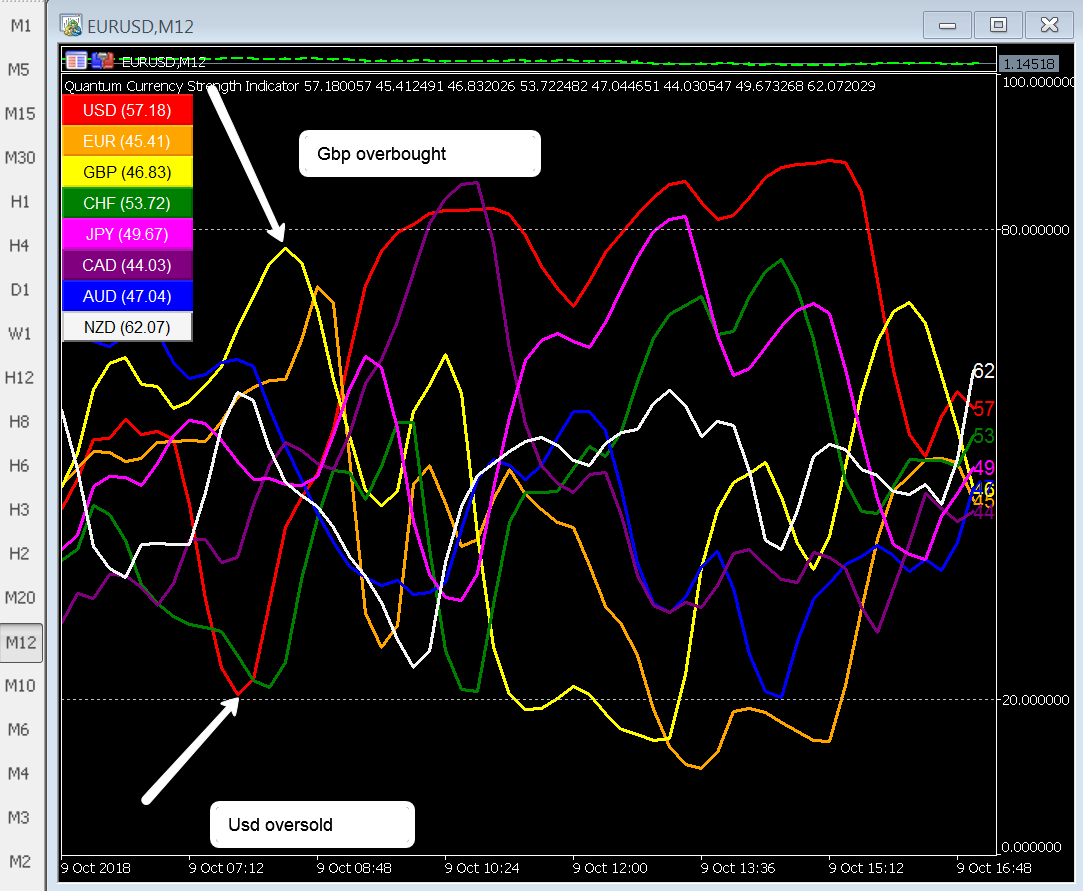
The move in cable began with a strong flows into the USD, which was also reflected in eurusd and the aussie dollar. In cable the move began in the 1.3099 region before the European open when both currencies were also at extremes on the 12 min CSI. At the open cable accelerated lower on rising volume until the price hit 1.3072 when the first hammer candle appeared on high volume, and appeared to be setting up for a reversal trade. However, as both David & I mentioned in the webinar as this price action was happening just before the London open it’s perhaps prudent to take a step back and wait to see what unfolds.The pair did rally and the open also triggered two simultaneous volatility candles that simply resulted in cable moving into congestion and sitting on the S1 level at1.3075.
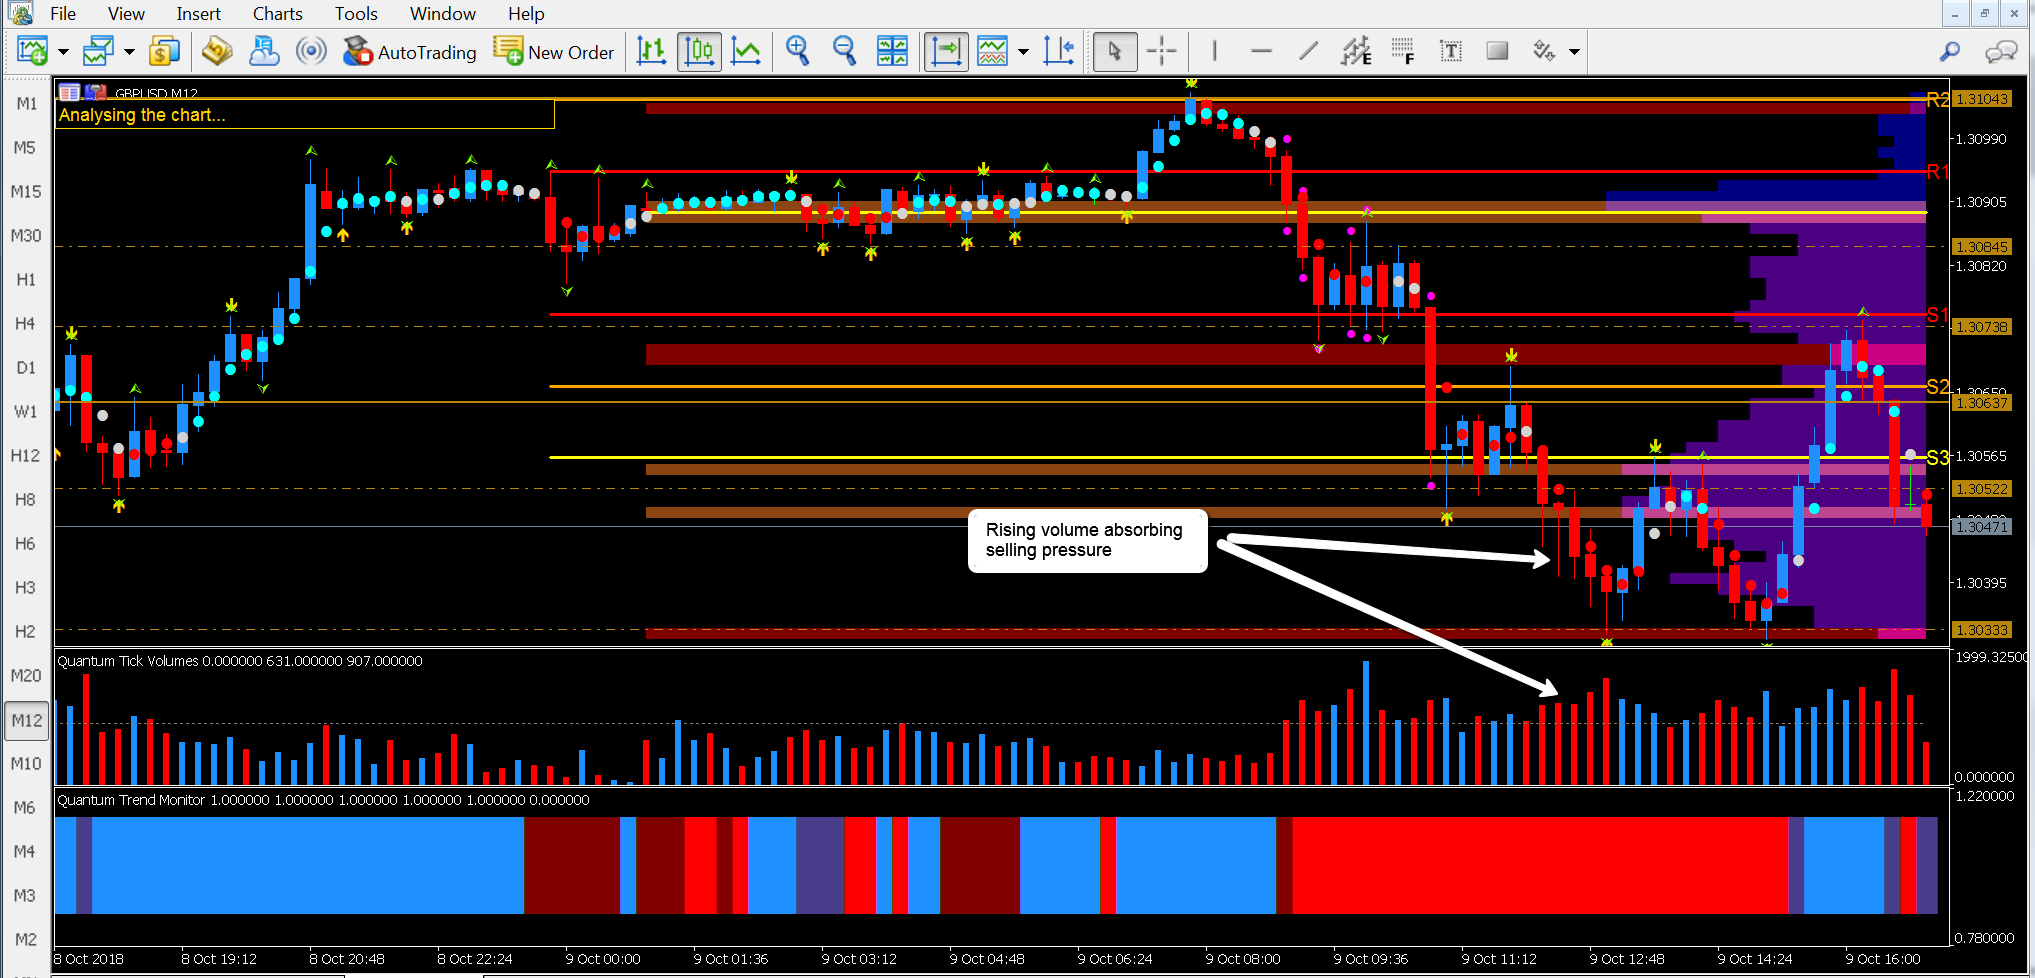
A break through this support managed to move the pair down to 1.3055 but also triggered yet another volatility candle on the 12 minute chart so it was not surprise to see cable move back into the spread of this wide spread down candle. Further consolidation followed in this region before the pair broke lower once again on rising volume, but what is significant in this price waterfall is all the candles have wicks to the bottom highlighting the strong buying that was coming in to absorb the selling pressure and bring the downwards trend to a halt. This finally happened on the hammer candle at the 1.3033 support line and a rally duly followed, but as this was on falling volume is a clear sign of weakness.This minor move higher also failed to take out the resistance at 1.3056 and cable once again pushed lower back to 1.3033, but on falling volume. The sharp rise in volume on the first blue candle not only created the eventual double bottom, but was also the first sign the pair would once again attempt to find some bullish momentum, and with the trend monitor also transitioning to blue cable was able finally to take out the strong resistance at 1.3056 and go on to test the congestion region at 1.3075. And, as we can see on the chart, this has held with selling pressure once again coming.


Leave A Comment