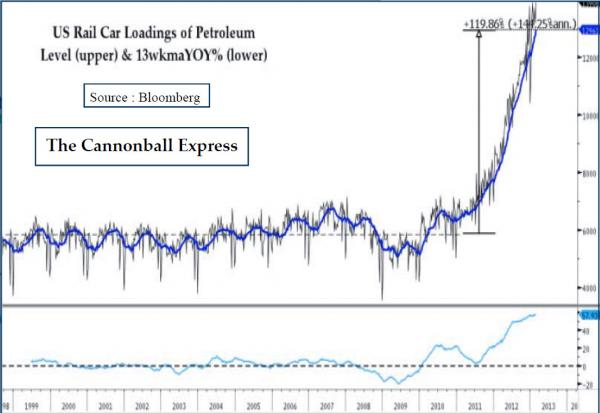
Back in November 2009, knowing he had both the inside track and the final decision on US energy policy under his crony president Obama, Warren Buffett acquired the 77% of the Burlington Northern Railroad (aka BNSF) he did not own for one simple reason: realizing he could pressure the “progressive president” Obama to curb all pipeline progress, confirmed recently with the terminal failure of TransCanada’s Keystone XL pipeline, Buffett would be ahead of everyone by controlling one of the key actors among “the New US Petroleum Pipelines.” The “pipelines” in question were shown in the following the New US Petroleum Pipelines.

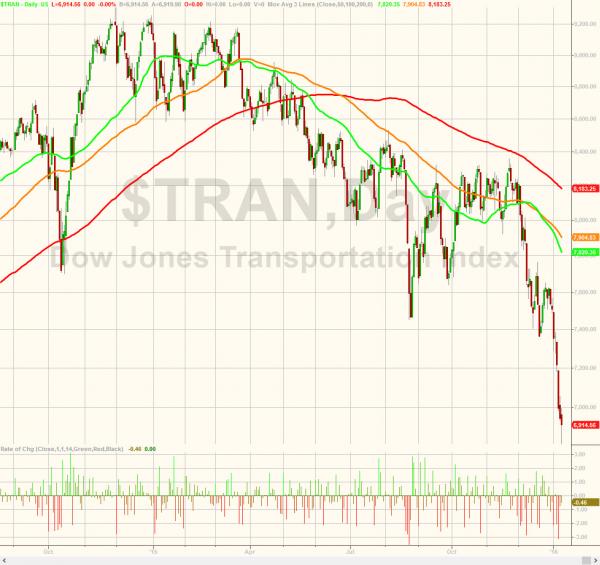
And while Buffett’s strategy worked great for many years, certainly as long as oil was rising and above $100, over the past year, things went downhill fast. Nowhere, was this more visible than in a one year chart of transports, which have crashed over the past several months entering their first bear market since 2008 in late December.
While all transportation components contributed to this plunge, rails were the biggest culprit. To be sure slumping railroad traffic was something we have covered extensively in the past year – together with ocean freight, together with trucks – and most recently covered it on January 3 in “What Rail Traffic Tells Us About The U.S. Economy.” The short answer: bad things.
But while we were quite concerned about the implications of plunging railroad traffic, others ignored it, claiming as they always do, that “it is only coal, or only oil, or only [insert commodity related factor]”.
However, a Bank of America report issued on January 6 revealed that the decline in rails was much more widespread than just “it’s only X.” This is what BofA’s Ken Hoexter said in a report titled “Carloads flashing a warning signal; lower 4Q estimates again”
Longest and deepest carload decline since 2009
We believe rail data may be signaling a warning for the broader economy. Carloads have declined more than 5% in each of the past 11 weeks on a year-over-year basis. While one-off volume declines occur occasionally, they are generally followed by a recovery shortly thereafter. The current period of substantial and sustained weakness, including last week’s -10.1% decline, has not occurred since 2009. In looking at carload data going back nearly 30 years, similar periods of weakness have occurred in only five other instances since 1985: (1) the majority of 1988, (2) the first half of 1991, (3) several weeks in early 1996, (4) late 2000 and early 2001, and (5) late 2008 and the majority of 2009. We exclude the period in 1996 from our analysis, as we consider it anomalous given that it overlapped with harsh winter conditions and was limited to January and early February of that year. Of the remaining instances, all either overlapped with a recession, or preceded a recession by a few quarters. The current period starting in October and continuing through the present has been accompanied by weak ISM results, with the purchasing managers index recently falling to 48.2 in December from 48.6 in November (a reading below 50 suggests contraction), and our proprietary BofAML Truck Shipper Indicator recently falling to its lowest level since 2012.


Leave A Comment