
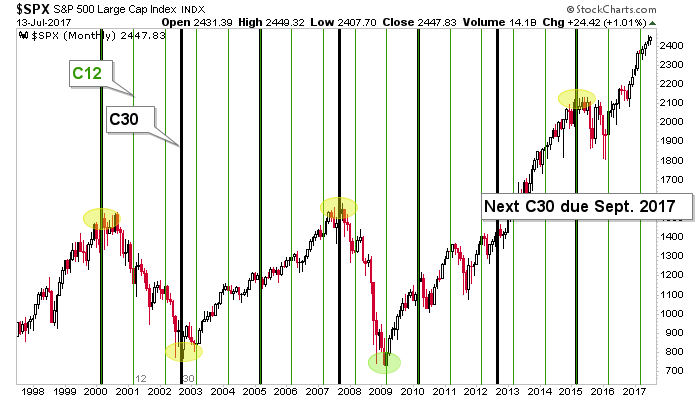
This “amateur cyclist’s” chart (I am anything but a cycles analyst) of the S&P 500 shows that the 12 month marker (C12) meant exactly nothing as the market remained firmly on trend, after brief pokes down in April and May. We noted that C12 was a lesser indicator than the 30 month cycle, which has coincided with some pretty significant changes (+/- a few months). That cycle (C30) is coming due at the end of the summer. Will it mean anything? Well, this market eats top callers for breakfast, lunch, dinner and midnight snacks. But it is worth knowing about to a lucid and well-armed market participant.
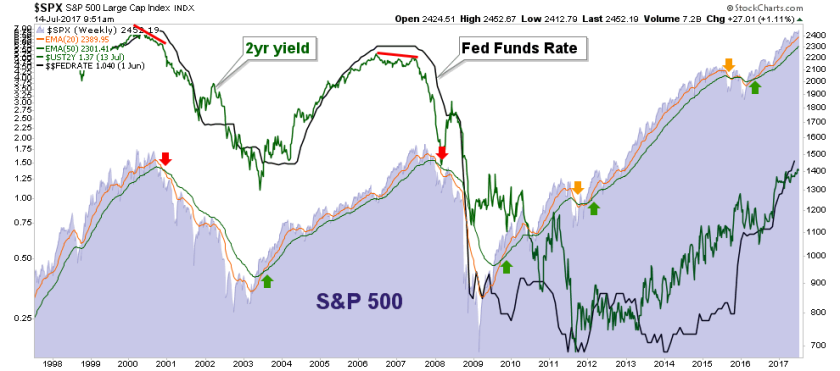
Here is the S&P 500 from another angle. The Fed Funds Rate (as of June 1) is now climbing in unison with the 2yr Treasury yield, and has even exceeded it. A problem for the stock market? Well, not quite yet when viewing historical context. The stock market has continued to climb in the short-term under conditions like this. But you will note that when the 2yr yield began to flatten and turn down, leaving the Fed in ‘overshoot’ territory, the major market tops of 2000 and 2007 were registered. Folks, I am not promoting an agenda, but simply reviewing history.
We have been in bull mode in one way or another since the height of the Brexit hysteria and its low risk bullish signals (as global herds rushed to risk ‘off’ sovereign bonds amid the knock-on NIRP!!! hysteria). More recently we have been bullish but in ‘risk’ mode, which continues and if the above cycles and Fed Funds analysis means anything, will only intensify. High risk does not mean bearish; it means high risk which, especially if the mania intensifies, can go hand in hand with reward.
As for the gold sector, look no further than our Macrocosm picture to see why the sector cannot yet be called bullish. At best, there are better places to invest as long as stock markets and the economy are doing well and out performing gold.


Leave A Comment