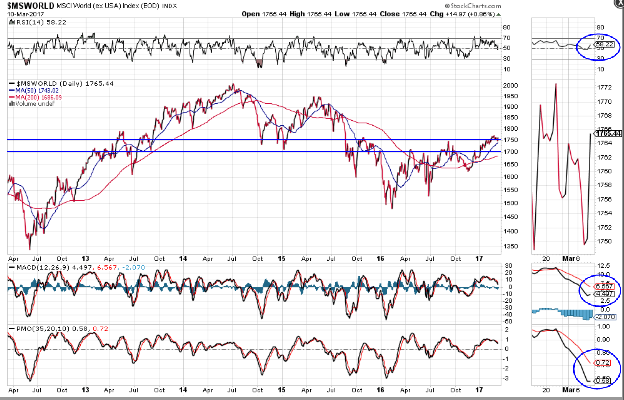
In my post of February 9th, I mentioned the importance of the World Market Index breaking, and holding above, 1750, as a potential signal of support for world equities, in the longer term, including that of the S&P 500 Index (SPX).
Since then, the World Market Index has, indeed, broken above and dipped back below 1750 several times, and closed out this week (March 10th) just above that level, as shown on the Daily chart below.
The RSI is in downtrend, but popped back above the 50 level, while the MACD and PMO indicators have yet to form bullish crossovers and remain in downtrend.

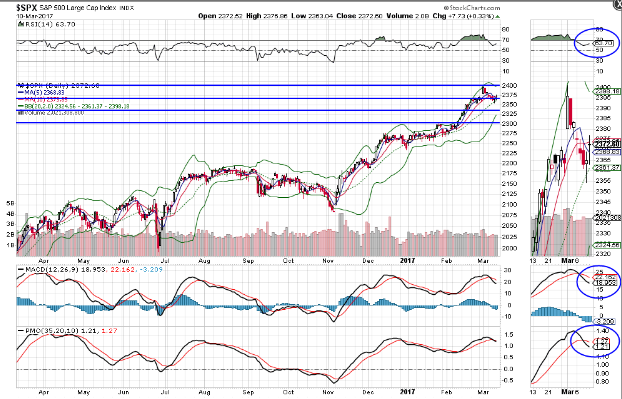
The SPX was, at the time of the above-referenced post, languishing just below 2300. It closed out this week at 2372.60, after my projected December 2017 target of 2400 was hit, 10 months early, on March 1st (see my same-day post here), as shown on the Daily chart below.
Short term resistance lies at 2400 and longer-term major support sits at 2300. At the moment, price is within the upper one-third (above 2366) of this resistance/support zone and remains above the middle Bollinger Band (2361.37) on this timeframe…favouring the bulls above these levels.
The RSI remains in uptrend and above the 50 level, while the MACD and PMO indicators have just formed a bearish crossover.
As shown on the following Daily chart, the SPX:VIX ratio has been swirling around the 200 level since January of this year and closed out the week at 203.48…favouring equity bulls. My last post on this ratio referred to this level as a new bull market territory for the SPX. So far, attempts to hold and advance much beyond this level have been short-lived…an indication that volatility is threatening to increase.
The RSI sits just above the 50 level, while the MACD and PMO indicators have yet to form a new bullish crossover, although downward momentum seems rather muted, so far.


Leave A Comment