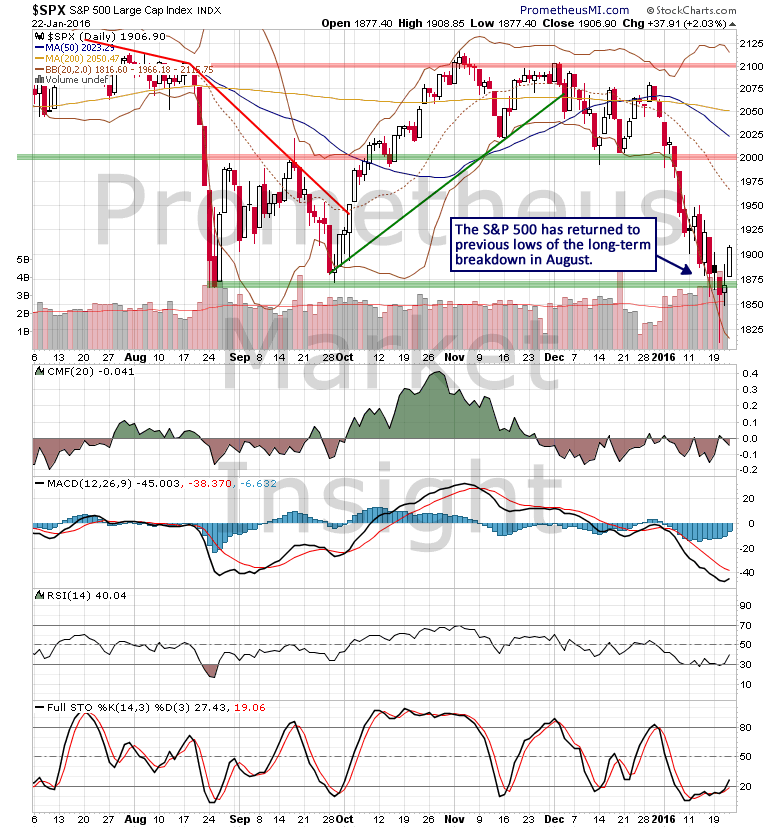
Last June, we observed developing weakness in the historic stock market bubble that suggested the bull market from 2009 had become susceptible to a long-term reversal. Following a long-term breakdown in August, the S&P 500 index rebounded violently and approached previous highs of the cyclical uptrend. However, after a period of mutual fund window dressing in December, prices declined violently for a second time, approaching previous lows of the breakdown in August.

From a long-term perspective, the stock market continues to exhibit typical behavior for the terminal phase of a highly speculative advance. Since the middle of 2014, the S&P 500 index has been forming a massive distribution pattern, indicating that the cyclical bull market from 2009 likely terminated in July of last year. Notice that technical indicators such as money flow, momentum and price oscillators have been steadily weakening as the formation has developed, further supporting the cyclical topping scenario.

The next significant technical development that would effectively confirm the start of a new cyclical downtrend would be a weekly close well below congestion support in the 1,880 area. However, it will be important to monitor the development of the latest short-term cycle that began last week. On Wednesday, our computer models predicted the likely formation of a short-term low, and the subsequent cycle low signal on Friday confirmed that a new cycle had begun.

The character of the initial phase of this new short-term cycle will indicate if the cyclical downtrend from 2015 is preparing to accelerate. Therefore, it will be important to monitor stock market behavior carefully during the next several weeks. We will identify the key developments as they occur in our daily market forecasts and signal notifications available to subscribers.


Leave A Comment