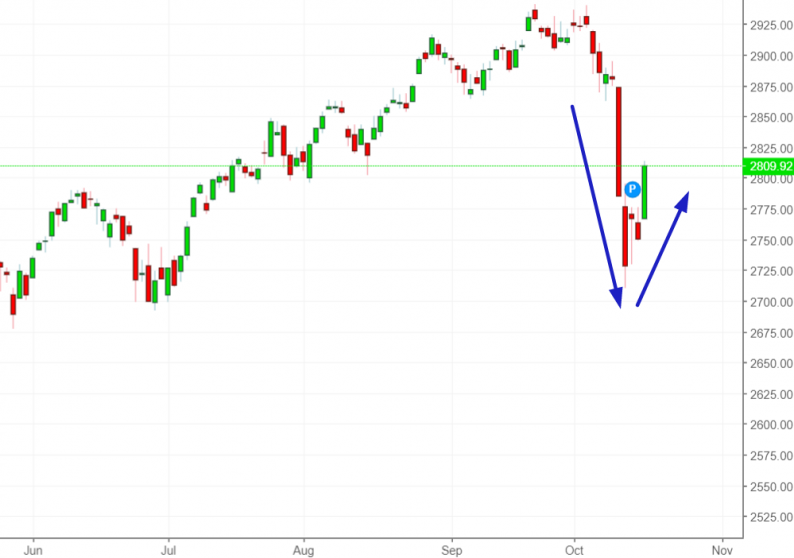
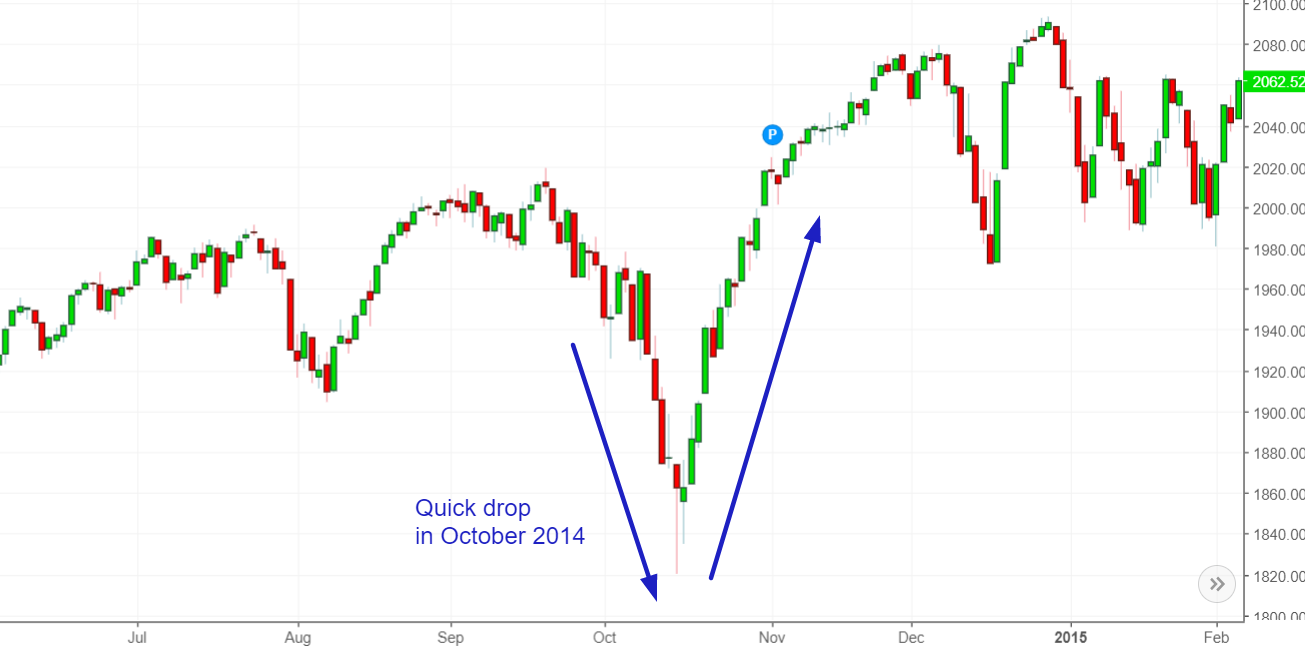
Yesterday’s big bounce has some people comparing the current market environment to October 2014, when the stock market dropped quickly and surged back to new all-time highs quickly.

The key point to remember is that:
Focus on the medium-long term.
With that being said, let’s get into quantifying and examining the stock market’s recent price action.
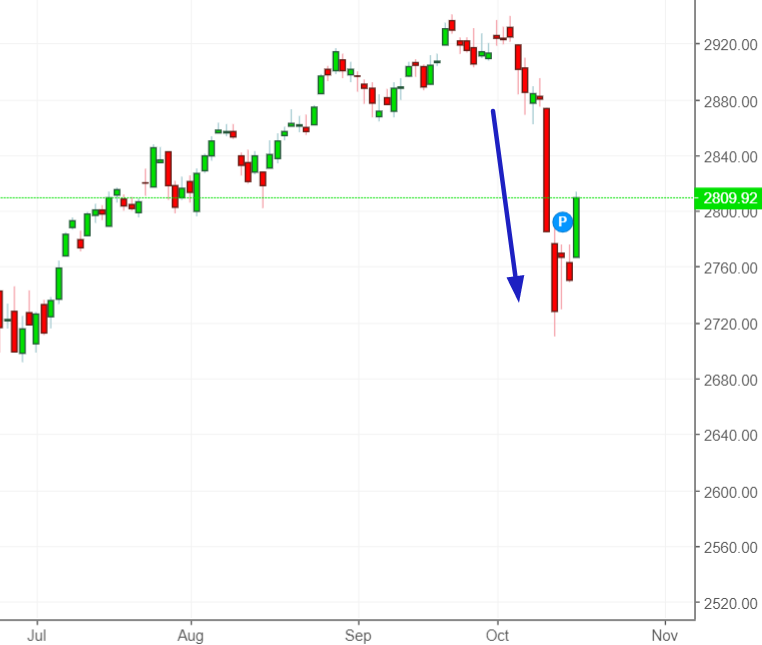
The stock market’s sharp reversal after a sharp drop
The stock market fell more than -2% for 2 consecutive days last week (Wednesday & Thursday), and then it rallied more than +2% yesterday.
This is what happens next to the S&P 500 when it falls more than -2% for 2 consecutive days, then rises >2% in 1 day within the next 3 days.
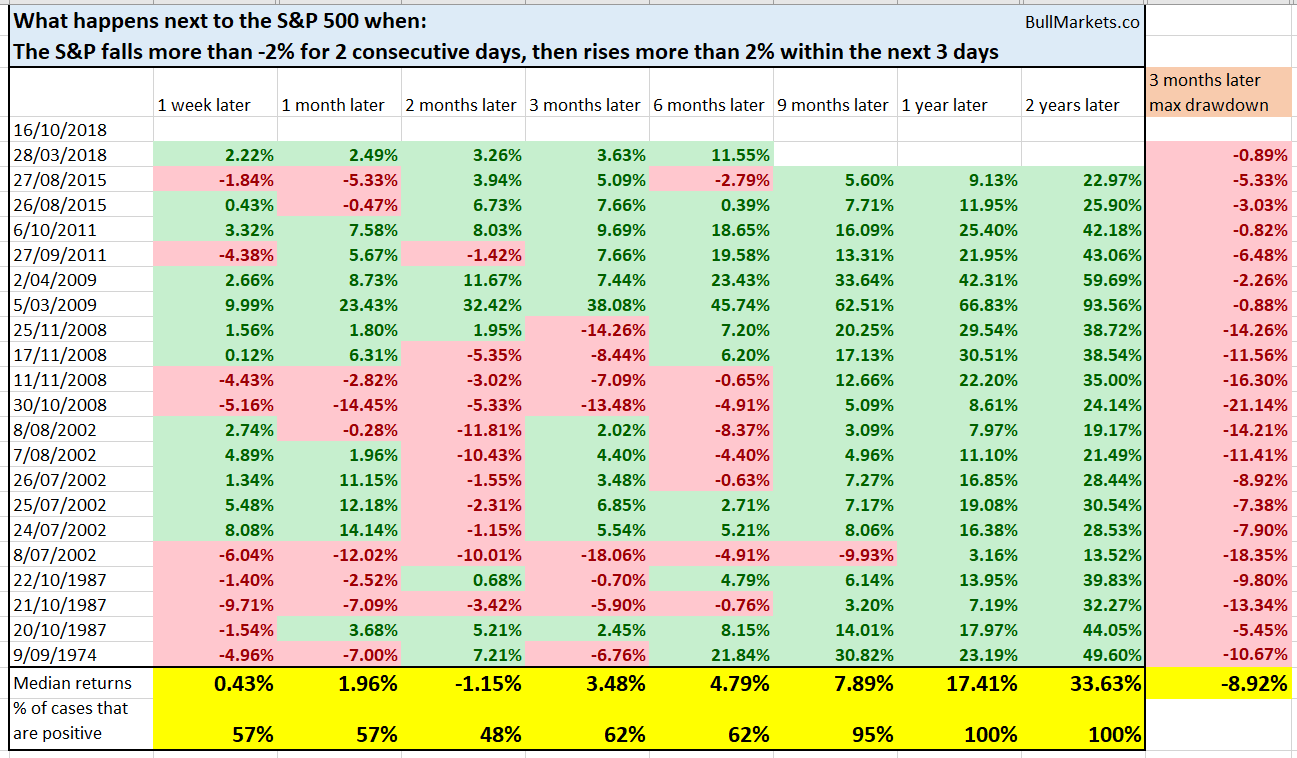
As you can see, this tends to happen at the bottom of bear markets or big 14%+ declines. The only other time it happened after a smaller decline was this March 2018 at the stock market’s bottom.
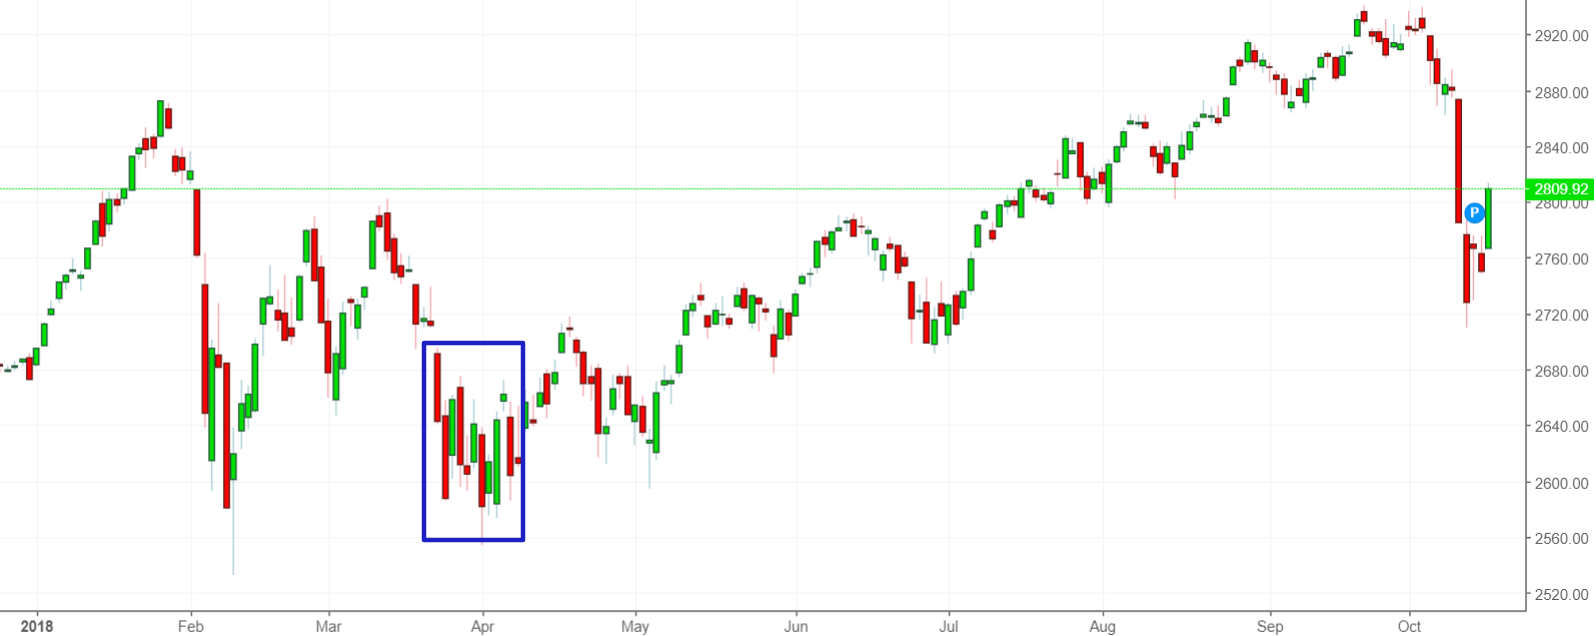
You can see that even in this case, the S&P retested its lows before heading higher.
Another way to examine the stock market’s sharp reversal
The stock market fell more than -6% in the past 1 month after making a new all-time high (using daily CLOSE $), and yesterday rallied more than 2%.
Here’s what happens next to the S&P 500 (historically) when it falls more than 6% from an all-time high in the past month, and then rallies >2% in 1 day.

Note that the S&P’s median drawdowns in the next 2-3 months is more than -3%, which supports the case for a retest.
However, what’s more interesting is that when this happens, the S&P goes up 3 months later 88% of the time. Even in the worst case scenarios (2000 and 2007 tops), the stock market still bounced. Bear markets don’t go down in a straight line.


Leave A Comment