
from the San Francisco Fed
— this post authored by Kevin J. Lansing
History suggests that extreme run-ups in the cyclically adjusted price-earnings ratio are a signal that the stock market may be overvalued. A simple regression model using a small set of macroeconomic explanatory variables can account for most of the run-up in the CAPE ratio since 2009, offering some justification for its current elevated level. The model predicts a modest decline in the ratio over the next decade. All else being equal, such a decline would imply lower stock returns relative to those in recent years when the ratio was rising.

Making judgments about the appropriate level of stock prices is a difficult and often humbling endeavor. One valuation metric, the cyclically adjusted price-earnings or CAPE ratio for the Standard & Poor’s (S&P) 500 stock index was originally developed by Campbell and Shiller (1998) to help judge whether the stock market is overvalued. The CAPE ratio is computed as the real, that is, inflation-adjusted, value of the S&P 500 divided by the real earnings of companies in the index averaged over the most recent 10 years. Campbell and Shiller found that higher values of the CAPE ratio predicted lower future real returns on stocks over subsequent 10-year periods. As noted in Siegel (2016), the CAPE ratio “has served as one of the best forecasting models for long-term future stock returns.”
This Economic Letter examines whether the current elevated level of the CAPE ratio can be justified by the prevailing macroeconomic environment. A parsimonious set of macroeconomic variables can account for much of the movement in the CAPE ratio over the past five decades. These variables include the “natural” real rate of interest, the growth rate of potential GDP, and the core inflation rate. Reasonable projections for these same macroeconomic variables over the next 10 years can provide a prediction about future movements in the CAPE ratio, which, in turn, will influence the magnitude of future stock returns.
The CAPE ratio in historical perspective
Figure 1 plots the CAPE ratio from 1881 to 2017; it shows five major stock price run-ups, including the most recent one that began in March 2009. Shiller (2000) argues that each of the first four run-ups coincided with the emergence of a “new era theory” in the popular culture that extolled the virtues of new technologies. The resulting investor enthusiasm fueled a “this time is different” mentality in which traditional valuation metrics were ignored, causing stocks to become overvalued relative to earnings. The exciting new technologies at the time included high-speed rail travel (early 1900s), automobiles and commercial radio (1920s), television and space travel (1960s), and the Internet (late 1990s). Stock price surges during each of these episodes pushed the CAPE ratio well above its long-run average. Each surge was followed by a substantial decline in stock prices that eventually pushed the ratio below its long-run average.
Figure 1
S&P 500 cyclically adjusted price-earnings (CAPE) ratio
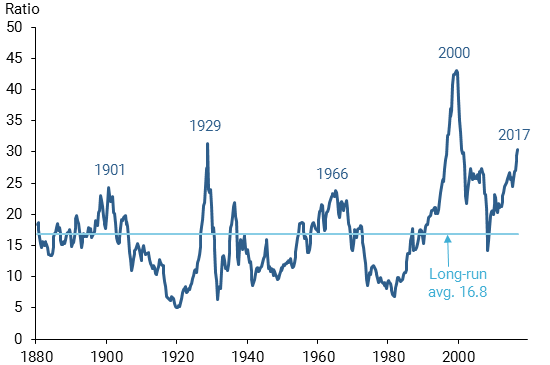
Source: Robert Shiller’s website.
At the end of the most recent data sample in 2017:Q3, the quarterly average CAPE ratio stands at around 30, exceeded only by the peak values of 43 in 2000 and 31 in 1929. Possibly taking note of this situation, the minutes of the June 13 – 14, 2017, Federal Open Market Committee (FOMC) meeting stated that “in the assessment of a few participants, equity prices were high when judged against standard valuation measures” (Board of Governors 2017a). But in contrast, the minutes of the July 25 – 26, 2017 FOMC meeting stated that a “couple of participants noted that favorable macroeconomic factors provided backing for current equity valuations” (Board of Governors 2017b).


Leave A Comment