
The economy and stock market move in the same direction in the medium-long term. Hence, leading economic indicators are also leading indicators for the stock market.
First signs of the bull market topping process
We’ve recently seen the first signs of U.S. economic deterioration. A bull market’s top is a long process.
We are now in Step 1 of this process.
Housing is starting to deteriorate
Housing indicators are usually the first to deteriorate. As the biggest of the big-ticket purchases, housing activity is usually the first to slow down when consumers are tapped out.
Housing indicators have deteriorated a little recently. Remember: the month-to-month fluctuations in economic data are meaningless. It’s mostly statistical noise. Focus on the overall trend in economic data.
As you can see in the following chart, New Home Sales has deteriorated a little recently.
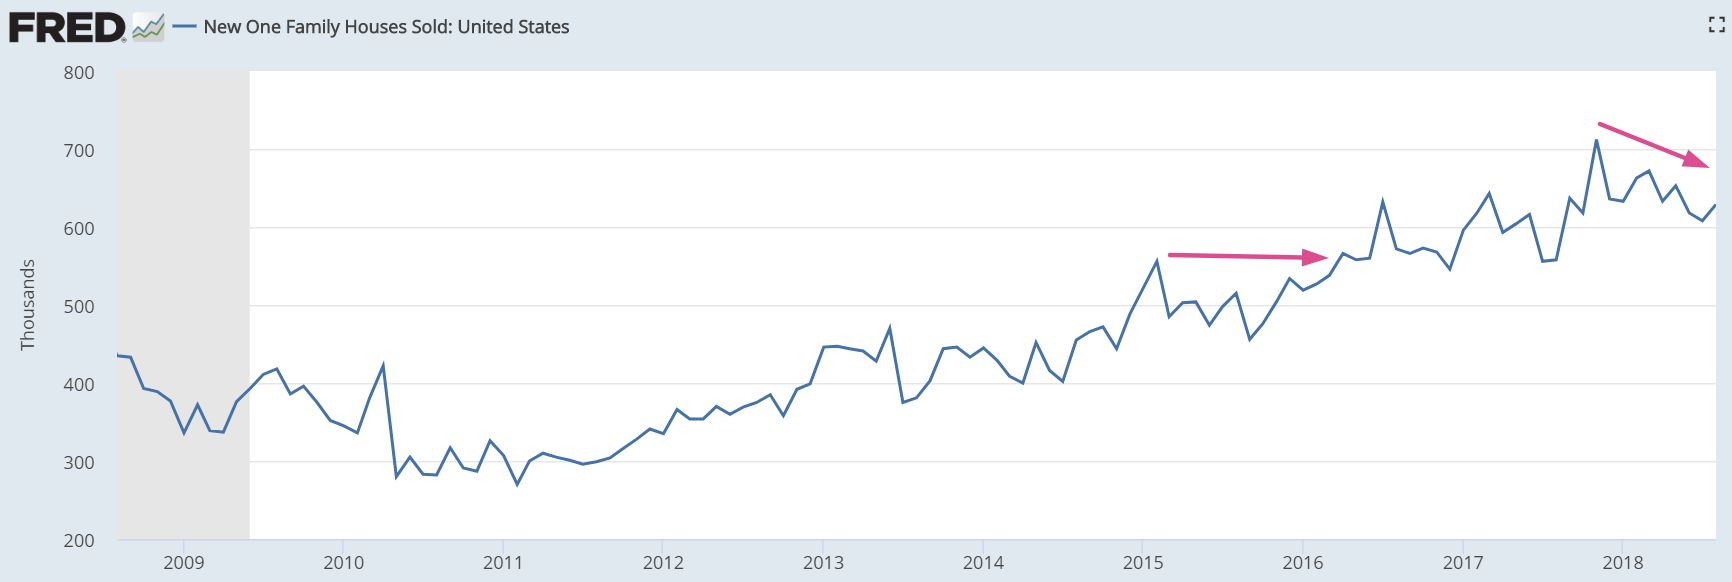
This is not a big concern yet, but watch out in case New Home Sales continues to deteriorate. It has been 9 months since New Home Sales printed an economic expansion high (November 2017). This isn’t unprecedented: it took 14 months for New Home Sales to make a new high from February 2015 – April 2016. But if new Home Sales doesn’t make a new high by Q1 2018, that’s a big warning sign that Stage 1 of the bull market topping process is complete.
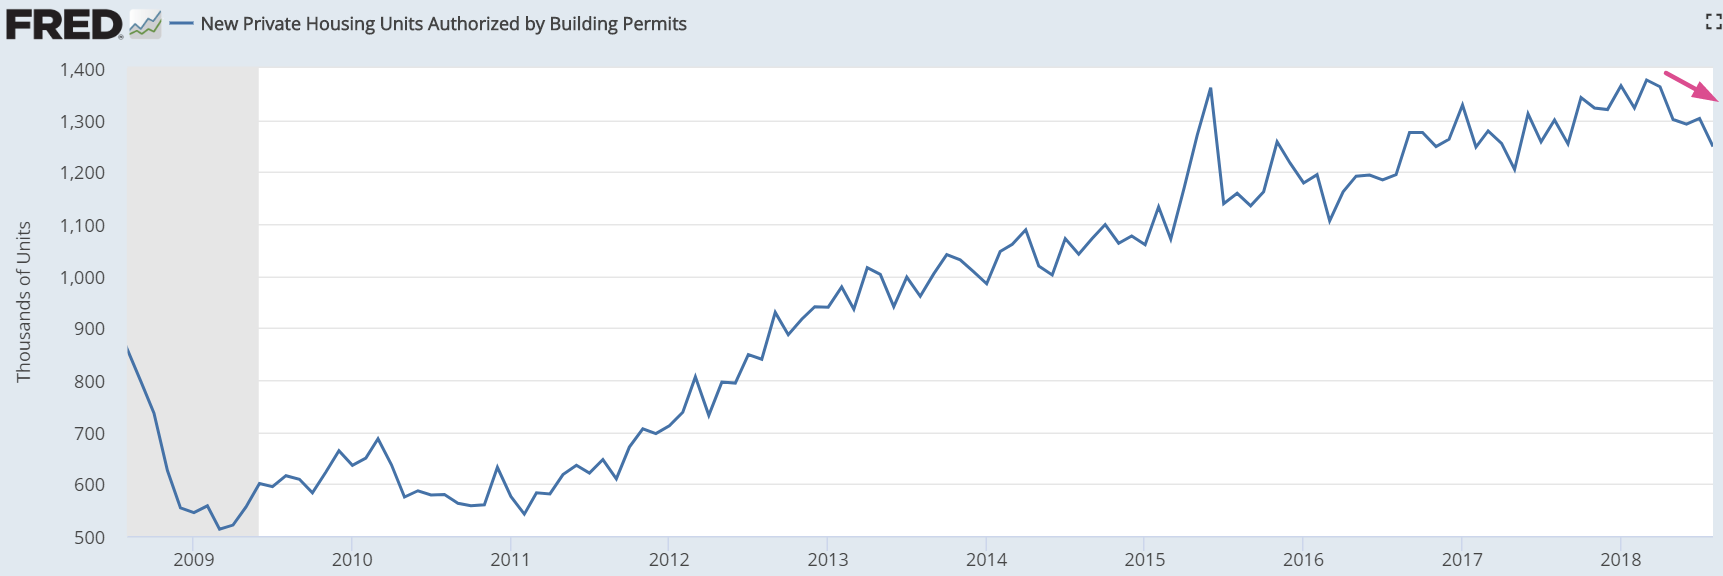
Likewise, Building Permits have trended down a little recently.
I am not too concerned yet is because Housing Starts has yet to show any meaningful deterioration.


Leave A Comment