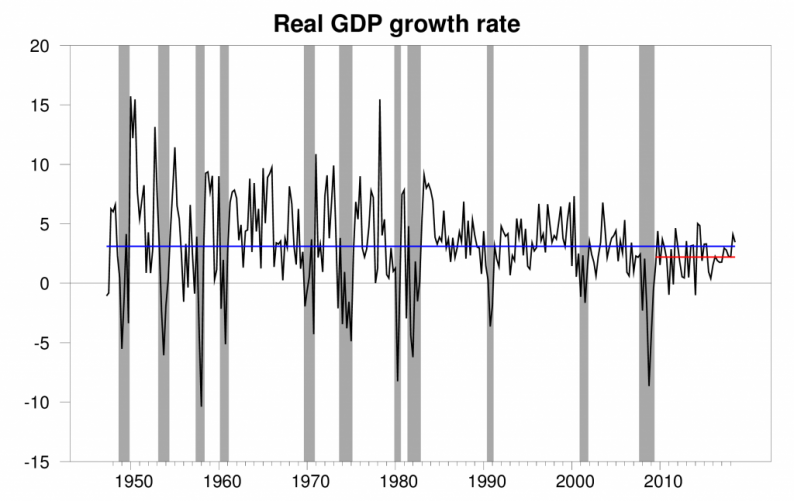
The Bureau of Economic Analysis announced today that U.S. real GDP grew at a 3.5% annual rate in the third quarter. That’s the second quarter in a row that the number has come in above the 3.1% average for the U.S. economy over the last 70 years and is well above the 2.2% average rate since the recovery from the Great Recession began

Real GDP growth at an annual rate, 1947:Q2-2018: Q3, with the 1947-2018 historical average (3.1%) in blue and post-Great-Recession average (2.2%) in red.
This brings the Econbrowser Recession Indicator Index all the way down to 1.1%, among the lowest levels we ever see. The U.S. remains clearly in the expansion phase of the business cycle.

GDP-based recession indicator index. The plotted value for each date is based solely on information as it would have been publicly available and reported as of one quarter after the indicated date, with 2018: Q2 the last date shown on the graph. Shaded regions represent the NBER’s dates for recessions, which dates were not used in any way in constructing the index, and which were sometimes not reported until two years after the date.
But the details behind that GDP growth concern me a little. Increased government spending contributed 0.6 percentage points to the GDP annual growth rate, with more than half of this coming from state and local government spending. Falling exports were a drag on growth– that much was expected. New Housing construction continued its three-quarter decline, and nonresidential fixed investment was also weak.

Most of the growth came from inventory build-up. GDP measures what is produced. If goods are produced but not purchased, inventories accumulate, so GDP can look strong even though spending is weak. Subtracting off inventories, real final sales were only up at a 1.4% annual rate in the third quarter.
I conclude that the fiscal stimulus continues to help give us a favorable headline number. But I am concerned about weak investment spending and final sales.

Related Posts
 What Powerball, Stocks, And Contrarianism Have In Common
- 5 Top-Ranked China Stocks To Buy As Growth Surges In Q1
- Gold Prices Eyeing SNB, BOE And ECB After Fed-Inspired Rally
 Gold Slips As Dollar Rebounds
- BlackRock Bitcoin ETF Logs 70 Straight Days Of Inflows, Surpasses $18 Billion In Assets
- Agriculture Markets Report – Friday, Dec. 22


Leave A Comment