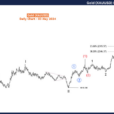
As you may long know, T2108 is one of my favorite indicators.
And that is saying something, considering that I really don’t much like indicators. But the T2108 is a great way of measuring the collective behavior and state of stocks across the board.

With the T2108 you measure the percentage of stocks trading above their 40-day moving average. To say the least, it has been quite a struggle for stocks for the past year and has seen numerous patterns that suggest greater distribution is taking place in the market place with equities.
As you’ll see below, the indicator, despite its best efforts, continues to put in lower-highs and lower lows. That is not the sign of a healthy market and now we are hitting a technical level on T2108 that suggests the dead cat bounce may be over and more extreme reading may be coming trader’s way with a move in SPX that will test the January lows again.


Leave A Comment