
(T2108 measures the percentage of stocks trading above their respective 40-day moving averages [DMAs]. It helps to identify extremes in market sentiment that are likely to reverse. To learn more about it, see my T2108 Resource Page. You can follow real-time T2108 commentary on twitter using the #T2108 hashtag. T2108-related trades and other trades are occasionally posted on twitter using the #120trade hashtag. T2107 measures the percentage of stocks trading above their respective 200DMAs)
T2108 Status: 47.9%
T2107 Status: 21.4%
VIX Status: 19.4
General (Short-term) Trading Call: bullish
Active T2108 periods: Day #5 over 20%, Day #4 over 30%, Day #1 over 40% (ending 48 days under 40%) (overperiod), Day #53 below 50%, Day #68 under 60%, Day #409 under 70%
Commentary
we r really close to having confirmed W (or double) bottoms on $SPY $VTI & $DIA . $QQQ & $IWM not far behind https://t.co/5KVKFWZq3b
— Michael Seneadza (@TraderMike) February 23, 2016
The S&P 500 (SPY) closed with a 1.2% gain and its highest close since January 7, 2016. The index also closed tantalizingly just below resistance at its 50-day moving average. If not for this resistance, I would declare a double-bottom already confirmed.
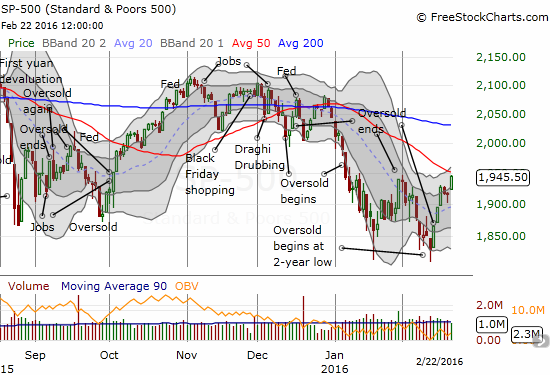
As this rally unfolds, the January and February lows are looking more and more like a double-bottom pattern. Buyers still need to accomplish an impressive close above 50DMA resistance.
T2108, the percentage of stocks trading above their respective 40DMAs, continues to add to the bullish vibes. My favorite technical indicator closed at 47.9%, its highest close since December 1, 2015. This steady climb combined with a rising S&P 500 represents a broadening rally. This is very healthy and indicates a definitive change in sentiment.
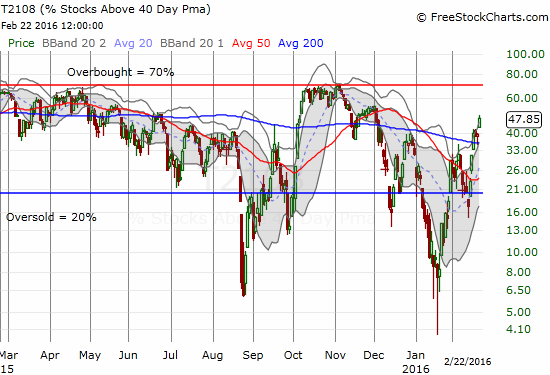
T2108 is showing an ever-expanding rally that is starting to look like October’s moonshot from oversold conditions.
The volatility index, the VIX, acknowledged the change in sentiment by confirming a breakdown below its 50DMA.


Leave A Comment