
(T2108 measures the percentage of stocks trading above their respective 40-day moving averages [DMAs]. It helps to identify extremes in market sentiment that are likely to reverse. To learn more about it, see my T2108 Resource Page. You can follow real-time T2108 commentary on twitter using the #T2108 hashtag. T2108-related trades and other trades are occasionally posted on twitter using the #120trade hashtag. T2107 measures the percentage of stocks trading above their respective 200DMAs)
T2108 Status: 11.9% (a plunge of 38%)
T2107 Status: 17.7%
VIX Status: 31.4 (up 10.4%)
General (Short-term) Trading Call: Bullish
Active T2108 periods: Day #8 below 20% (oversold), Day #9 under 30%, Day #32 under 40%, Day #72 under 50%, Day #89 under 60%, Day #287 under 70%
Reference Charts (click for view of last 6 months from Stockcharts.com):
S&P 500 or SPY
SDS (ProShares UltraShort S&P500)
U.S. Dollar Index (volatility index)
EEM (iShares MSCI Emerging Markets)
VIX (volatility index)
VXX (iPath S&P 500 VIX Short-Term Futures ETN)
EWG (iShares MSCI Germany Index Fund)
CAT (Caterpillar).
Commentary
T2108 took a fresh plunge that promises to extend this oversold period into the history books. T2108 plunged to 11.9% from 19.1% and marked an 8th straight day in oversold territory. Of the 66 oversold periods that have occurred from 1986 to 2014, only 14 (21%) have lasted over 8 days. The last oversold period that lasted at least as long as the current one was the 17-day stomach-churner in August, 2011 that was part of the debt ceiling madness.
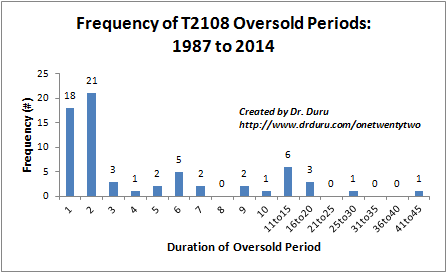
The majority of oversold periods last one or two days.
The chart above shows that 39 (59%) of all oversold periods last just one or two days. This skewed distribution is part of what makes the T2108 trading strategy work (and the variants I have developed since the original development of the strategy). Once the oversold duration gets as long as the current one, managing drawdowns become a more important component of the strategy. Risk management comes into play by watching VIX thresholds. For example, to start this week, I advised less aggressive traders to put buying plans aside given the VIX had returned to the “dangerzone.” With yesterday’s selling on the S&P 500 for a 3.0% loss, the VIX moved deeper into the dangerzone.
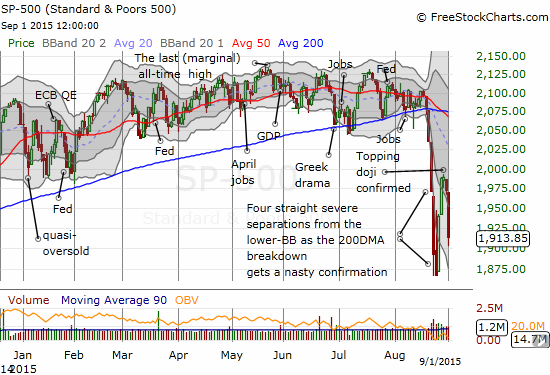
The S&P 500 has confirmed a short-term topping pattern with a second day of selling that accelerated a fresh downdraft
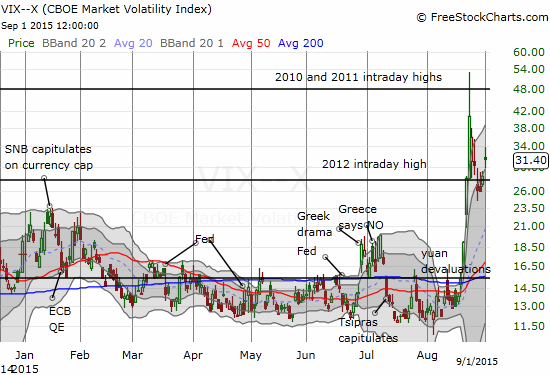
The volatility index refreshes itself and looks poised to make a new run upward.
As I noted in I advised less aggressive traders to put buying plans aside given the VIX had returned to the “dangerzone., the VIX’s move higher off the low from the day with the last big surge implies that even lower levels on the S&P 500 are ahead. The persistent elevation of the VIX means that the stock market should continue to experience large swings up AND down along the way.


Leave A Comment