
(T2108 measures the percentage of stocks trading above their respective 40-day moving averages [DMAs]. It helps to identify extremes in market sentiment that are likely to reverse. To learn more about it, see my T2108 Resource Page. You can follow real-time T2108 commentary on twitter using the #T2108 hashtag. T2108-related trades and other trades are occasionally posted on twitter using the #120trade hashtag. T2107 measures the percentage of stocks trading above their respective 200DMAs)
T2108 Status: 16.7% (intraday high of 19.99% – seriosuly!)
T2107 Status: 21.8%
VIX Status: 25.6
General (Short-term) Trading Call: Bullish
Active T2108 periods: Day #10 below 20% (oversold), Day #11 under 30%, Day #34 under 40%, Day #74 under 50%, Day #91 under 60%, Day #289 under 70%
Reference Charts (click for view of last 6 months from Stockcharts.com):
S&P 500 or SPY
SDS (ProShares UltraShort S&P500)
U.S. Dollar Index (volatility index)
EEM (iShares MSCI Emerging Markets)
VIX (volatility index)
VXX (iPath S&P 500 VIX Short-Term Futures ETN)
EWG (iShares MSCI Germany Index Fund)
CAT (Caterpillar).
Commentary
The upcoming and much-anticipated U.S. jobs report could completely alter the technical landscape, so I am keeping this T2108 Update short and sweet. (I know – finally!).
T2108 closed at 16.7% for a 10th straight day in oversold territory. Of 66 oversold periods since 1986, only 11 (17%) have lasted longer.
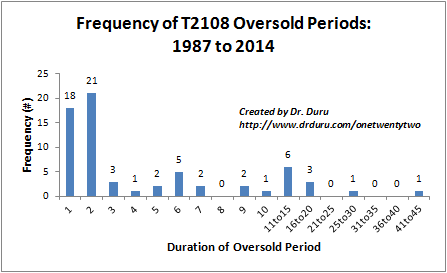
The majority of oversold periods last one or two days
Given this stretch of time, it is only natural that T2108 continues to make moves to breakout and end the oversold period. Today, T2108 traded as high as 19.99% which is .01 percentage point away rom the oversold threshold – I just cannot make this stuff up.
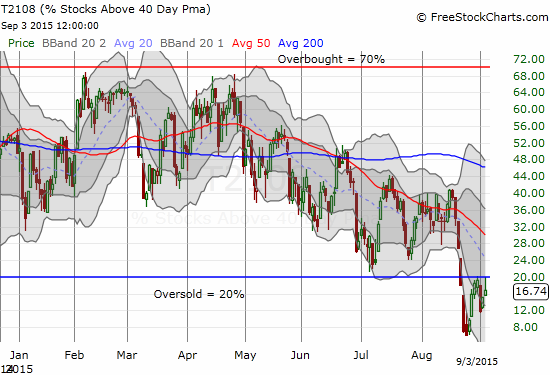
T2108 knocks on the exit gate of a historic oversold period
T2107, the percentage of stocks trading above their 200-day moving averages (DMAs), also rose right to an important exit gate: a higher high that could have started an uptrend from recent lows.


Leave A Comment